Chrome DevTools MCP lets agents open Chrome and test it
Watch an agent use chrome-devtools-mcp to find why a page's LCP is slow and where memory leaks, then see the controls to set before you turn it on.
On a Thursday afternoon, right after you touch the product list page, a report lands in the QA channel: “The first screen stays blank for a while, then the images show up.” Ask an agent why and it will usually read the code and offer a guess like “the images are probably too large.” It has never opened Chrome and measured anything, so a guess is all it can give. Attach chrome-devtools-mcp, an open-source MCP server maintained by the Chrome DevTools team, and the answer to the same question changes. The agent opens the page itself, runs a performance trace, and tells you in numbers which stage stretched the time until the largest piece of content was painted (LCP).
This article follows that day. Setup, the first call, narrowing down the cause and re-measuring after the fix make up the first report. Then a second report, “memory keeps piling up the more I open the modal,” is judged with three snapshots, and the end lists what to control before you switch it on. The page (staging.example.com/products) and the figures are examples made up by the editors for illustration; the tool names, arguments and judgment thresholds come from the official docs and the skill docs. As of 2026-10-27 UTC the tool is Apache-2.0 licensed, has 54,197 GitHub stars, and its latest npm release is 1.12.0 from October 22. It changes fast: six releases have shipped since 1.8.0 on August 25. The README title is now “Chrome DevTools for agents,” while the package name stays the same.
One line of setup and a first prompt to confirm it
You need Node.js LTS (the package requires 20.19 or later, or 22.12 or later), the latest stable Chrome, and npm. The standard way is to put the block below into your agent client’s MCP settings.
{
  "mcpServers": {
    "chrome-devtools": {
      "command": "npx",
      "args": ["-y", "chrome-devtools-mcp@latest"]
    }
  }
}
@latest makes the client use the newest server every time it starts. In a team setting that needs reproducibility, pinning a version is better. Claude Code has two routes: a one-line command that adds only the server, and a plugin route that installs the server together with seven skills. The diagnosis steps this article follows (five LCP stages, three snapshots) are written in the skill docs, so if you want the agent to follow the same order, the plugin route is the right one.
- Run
node -vand check that it is 20.19 or later (22.12 or later on the 22 line). - To use only the server, run
claude mcp add chrome-devtools --scope user npx chrome-devtools-mcp@latest. To use the skills as well, run/plugin marketplace add ChromeDevTools/chrome-devtools-mcpand then/plugin install chrome-devtools-mcp@chrome-devtools-plugins. If you already installed the server alone, the docs tell you to remove that installation before installing the plugin. - Restart Claude Code. If you installed the plugin, check that the skills appear in
/skills. - Send the README's check sentence, "Check the performance of https://developers.chrome.com," as it is. If a Chrome window opens and a performance trace is recorded, you are connected.
Connecting the server does not open Chrome right away. The README states plainly that the browser starts when a tool is first needed. While you leave it connected and work on something else, Chrome stays off.
What passes back and forth in the first call: Chrome launch, uid, trace summary
The figure below shows the sequence one confirmation prompt creates between the server and Chrome. The red arrow marks the point where Chrome starts for the first time, and the dotted lines are the responses returning to the agent.
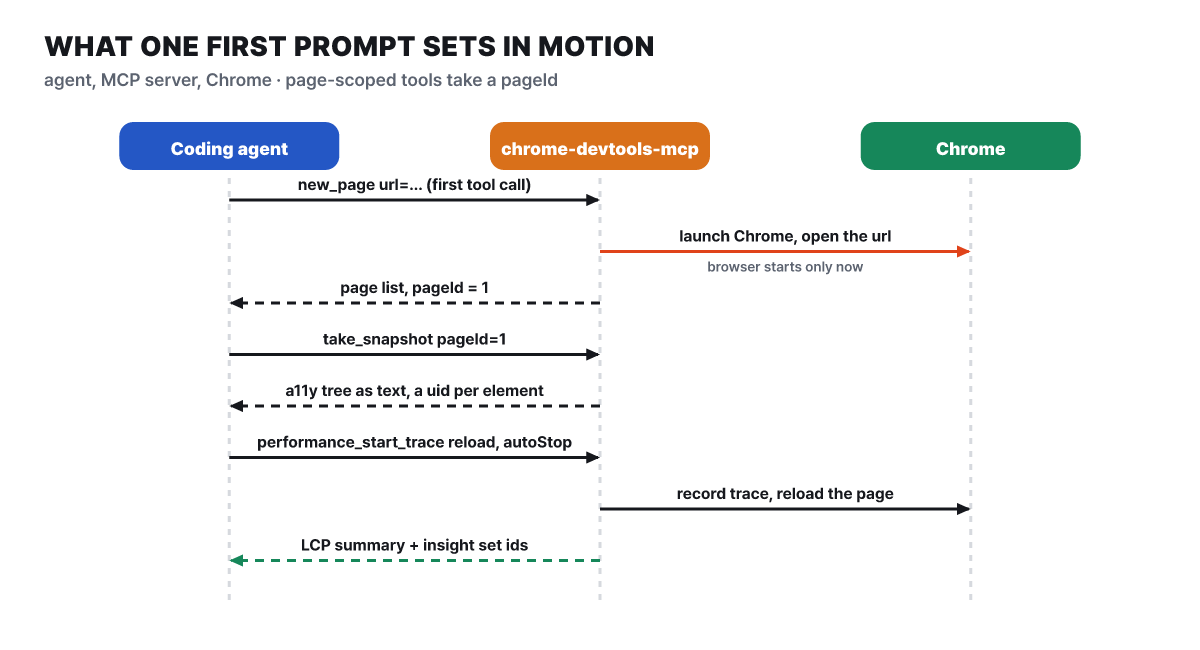 Figure 1. Chrome starts on the first tool call, and later responses are text summaries
Three points are worth noting. First, the Chrome that the server launches itself keeps a dedicated profile folder between runs (on Mac and Linux, $HOME/.cache/chrome-devtools-mcp/chrome-profile), so a site you logged in to once stays logged in on the next run. Second, every tool that makes a page do something takes a pageId. Since 1.8.0 this is required by default, so even when several agent sessions share one server, each points at its own tab. Third, instead of looking at a picture of the screen and picking coordinates, the agent reads the accessibility tree returned by take_snapshot as text. Each element carries a uid, and click and fill take that uid. The tool descriptions say to prefer snapshots over screenshots and to always use the most recent snapshot. click_at, which clicks by coordinates, appears only when you turn on --experimentalVision.
Summary-style responses are a design principle. The project’s design document says “LCP was 3.2s” beats a 50,000-line JSON, and that heavy material such as screenshots, traces and video should come back as a file path rather than as a value. So from a single trace the agent receives the LCP time and a list of “available insight sets,” and it gets the details by asking back one by one with performance_analyze_insight. If you need the raw trace, give a filePath and it is saved to a file.
One trace splits an LCP of 3.9 seconds into four parts
Back to the first report: give the agent the address staging.example.com/products and ask it to look at performance. The skill defines the start as two calls. Open the address with navigate_page, then call performance_start_trace with reload: true and autoStop: true. To measure a first visit that bypasses the cache, also pass the ignoreCache option added in 1.11.0. The example result is an LCP of 3.9 seconds. The thresholds the skill quotes are good at 2.5 seconds or less, needs improvement from 2.5 to 4.0 seconds, and poor above 4.0 seconds, so this falls in the middle band.
One number does not tell you where to fix, so the skill splits LCP into four consecutive stages. They are the time until the server sends the first byte (TTFB), the wait after that until the browser requests the LCP element’s resource (load delay), the time to download the resource (load duration), and the wait after the download until it is painted on screen (render delay). The ideal shares are about 40% for TTFB and about 40% for load duration, and under 10% each for the two delay stages. The delay stages are “time spent waiting,” so the closer to 0 the better.
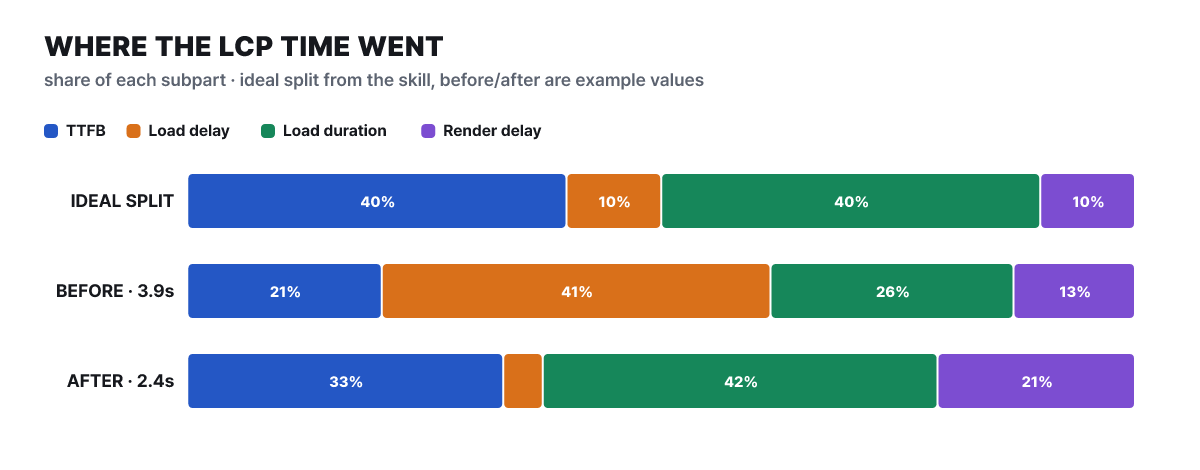 Figure 2. The top bar is the skill’s ideal split; the middle and bottom bars are assumed example values (ratios calculated by the editors)
For now, look only at the top two rows (the bottom row is the result after the fix, which we revisit two sections later). Unlike the ideal split, the before-fix bar has its longest stage in load delay: 41%, or 1.6 seconds. Downloading the image took only 1.0 second, and the wait before the download began is longer than that. Shrinking the image file here would be wasted effort. The skill docs also list optimizing only one stage without checking the others as a common trap: the time you save by shrinking the file just moves into render delay.
Three queries to narrow down the culprit, and a one-line fix
Once the stages are checked, the skill also sets the order for narrowing the cause. Of the four insight names (LCPBreakdown, DocumentLatency, RenderBlocking, LCPDiscovery), you open LCPBreakdown, which provides the stage table, first. Then you ask in turn what the LCP element is and why that element’s request was late.
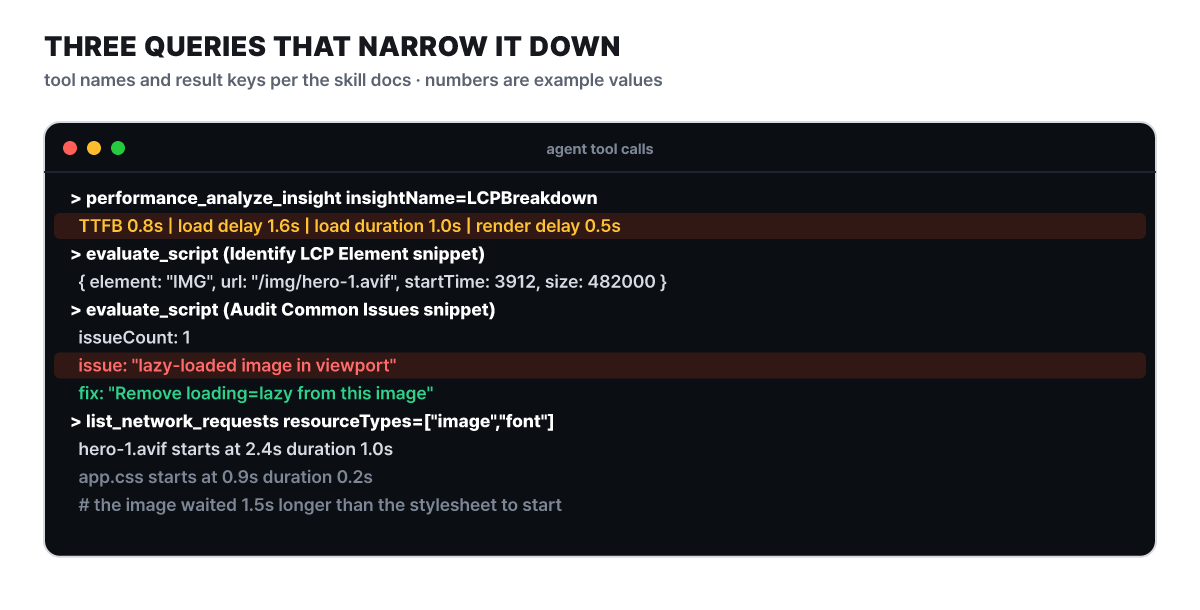 Figure 3. Four diagnostic calls. Tool names and result keys follow the docs; the numbers are example values
The two evaluate_script calls run snippets from the skill’s reference document (references/lcp-snippets.md). The first snippet observes the largest-contentful-paint entry and returns the LCP element’s tag, address (url), and start and render times. If url is empty, the element is text and there is no resource to follow. In this example, IMG and /img/hero-1.avif came back. The second snippet finds images that are on screen but carry loading="lazy", large images without fetchpriority, and scripts in <head> without async or defer, and puts them in an issues array. Finally it calls list_network_requests with resourceTypes: ["image","font"] to see when the LCP image started.
The result points to one place. The stylesheet request started at 0.9 seconds, but the hero image started only at 2.4 seconds, and that 1.5-second gap matches the load delay of 1.6 seconds. The cause is that lazy loading was applied to an image visible on the first screen. This is exactly the skill’s first prescription: do not lazy-load the LCP image, and give it fetchpriority="high" if needed.
<!-- Before -->
<img src="/img/hero-1.avif" loading="lazy" alt="This week's popular products">

<!-- After -->
<img src="/img/hero-1.avif" fetchpriority="high" alt="This week's popular products">
Only one line changed, but what matters is that the evidence for how the agent picked this line is preserved in four calls. With the guess “the image is large,” it would have started by compressing the file and, as the trap above shows, the number would hardly have moved.
Measure again, then measure again on a slow device
After the fix, run the same trace once more. The skill’s verification step is the same: call performance_start_trace with reload: true again and compare the stage shares. The bottom row of Figure 2 is that result. In the example, LCP is 2.4 seconds, which lands in the good band (2.5 seconds or less), and load delay dropped from 1.6 seconds to 0.1 seconds. But the render delay of 0.5 seconds now rises to the second candidate at 21%. Clearing the biggest bottleneck usually reveals the next one, and you can go another round the same way.
Finally, check the console. list_console_messages returns console messages since the last navigation, and types lets you filter by kind to see only errors. If you need stack traces, turn on includeStackTraces. That option arrived in 1.8.0, and it comes at the cost of larger responses. The use of this server is checking, inside the same conversation, that the fix did not create a new error.
Values measured on a development machine tend to be faster than on a user’s device. The skill advises you to imitate a slow environment by passing emulate the values networkConditions: "Fast 3G" and cpuThrottlingRate: 4. The tool description says that every call to emulate replaces the previous emulation settings wholesale (except extra HTTP headers), so you must pass all the settings you want in one go. The remedies to try first for each stage are below.
| Stage (ideal share) | What a large value tells you | Do this first |
|---|---|---|
| TTFB (about 40%) | The HTML arrives late | Cut redirects, improve server response, cache the HTML at the edge (CDN), make the page eligible for the back/forward cache |
| Load delay (under 10%) | The LCP element’s request starts late | Never put loading="lazy" on the LCP image, add fetchpriority="high", use preload if it is not discovered in the HTML |
| Load duration (about 40%) | The resource is large or delivery is slow | WebP/AVIF and srcset, CDN, Cache-Control, font-display: swap if text is the LCP |
| Render delay (under 10%) | It cannot paint even after downloading | Inline critical CSS, defer non-critical CSS and JS, break up long tasks, server-side rendering |
A trace is a lab measurement. The performance tools of this server can send the traced address to the Chrome UX Report (CrUX) API and attach real-user values next to it, and this feature is on by default. When you trace an address you do not want to disclose, such as an internal staging site, turn it off with --no-performance-crux. The default trace buffer has been 1.2GB since 1.9.0, and 1.10.0 added a parser that reads large recordings in chunks.
The report that memory piles up each time you open and close the modal
The second report is the kind that is hard to find by eye. When you open and close the product detail modal repeatedly, tab memory rises little by little (this case is also an editors’ example). The memory tools exist to catch leaks like this, and 13 of the 14 appear only when you turn on --memoryDebugging. The only one you can use without the flag is take_heapsnapshot, which takes a snapshot. Turned on through the config file, it looks like this.
{
  "headless": true,
  "isolated": true,
  "memoryDebugging": true
}
You take three snapshots: the baseline before the action, after repeating the suspect action about 10 times, and after restoring the screen to its original state. You repeat to amplify a small leak until it stands out, and you shoot again after restoring to tell normal memory use from a leak. It is natural for memory to rise while the modal is open. Only if memory is still above the baseline after you close it and restore everything is that evidence that something is holding on. The open and close actions are done by calling click with the uid from the take_snapshot we saw earlier.
The skill’s reference document lists five common leak shapes: event listeners that were not removed, DOM nodes detached from the screen but still pointed to by a variable, unintended global variables, closures holding large objects, and caches or arrays that grow without limit. The tool does not find this classification for you. It is a reference table for reading which line of code the path in the report leads to.
Walking back from three snapshots to whoever holds on
The branching of the verdict and the trace is shown in the figure below. The top band takes the three snapshots, the middle band checks whether the third is higher than the first, and only when it is higher do you go down to the trace in the bottom band.
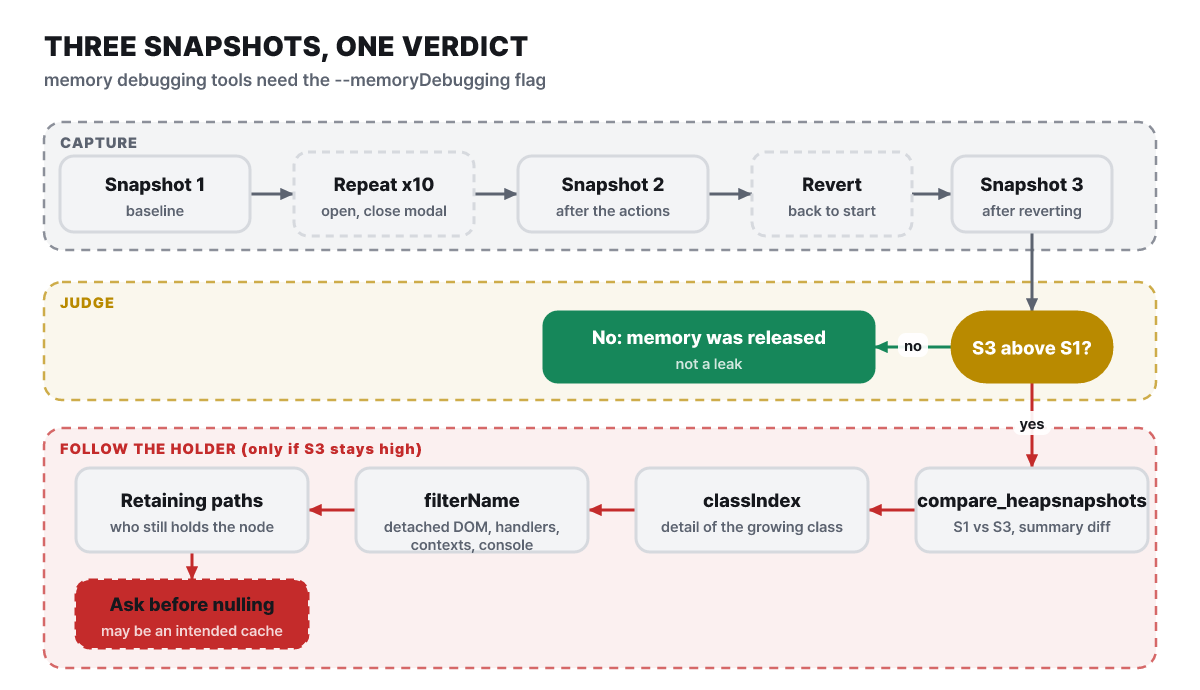 Figure 4. If the third has returned to the baseline, it is not a leak; if it remains, find whoever holds it and climb up
The agent calls tools in this order.
- Give
take_heapsnapshotafilePathto save the baseline snapshot to a file. After repeating the action, and after restoring, save two more the same way. - Use
get_heapsnapshot_summaryto see whether the three files open and how their total sizes differ. - Give
compare_heapsnapshotsthe baseline file and a later file to get a summary of differences, and look up only the classes that grew in detail byclassIndex. - Give
get_heapsnapshot_detailsorget_heapsnapshot_class_nodesafilterNameto filter by cause. You can tell apart objects held by detached DOM, objects held by event handlers, objects trapped in closure contexts, and objects left in the console. - Give
get_heapsnapshot_retainersandget_heapsnapshot_retaining_pathsa node number to see the path of who is holding it. When the investigation is done, release the memory the server holds withclose_heapsnapshot.
Two things to keep to in this procedure. Do not let the agent read the raw .heapsnapshot file itself. The files are very large and cost a lot of tokens, so the skill insists on using only the summary, comparison and path tools. Also, not every detached DOM you see is a bug. It may be a cache the site built on purpose, so the skill says to ask the user before removing a reference. In this example, if the path led to a single modal close handler, a person only needs to confirm that the handler is attached to window without removeEventListener and fix it.
The tools keep growing too. 1.11.0 added analyze_heapsnapshot_contexts, which ranks the contexts where a closed closure still holds values nobody can read, and added pagination and a name length limit to comparison results. The docs state that this ranking is an estimate for prioritizing, not the exact bytes that can be reclaimed. From 1.12.0, saved snapshot files can be analyzed without a browser connection. That means you can continue the investigation after closing Chrome as long as you have the files.
Of 59 tools, the ones this job touched
The tools the agent called while handling the two reports in this article cluster in a few categories. The tool reference for the released 1.12.0 lists 59 tools in 11 categories. On October 23, configure_webauthn (--categoryWebauthn), which sets up a virtual WebAuthn authenticator, was merged into the main branch, so the main-branch docs show 60 tools in 12 categories.
| Category | Count | Default state | In this job |
|---|---|---|---|
| Input automation | 10 | On | Opening and closing the modal with click |
| Navigation automation | 6 | On | new_page, navigate_page |
| Emulation | 2 | On | Fast 3G and 4x CPU slowdown with emulate |
| Performance | 3 | On | performance_start_trace, performance_analyze_insight |
| Network | 2 | On | list_network_requests, get_network_request |
| Debugging | 9 | On | take_snapshot, evaluate_script, list_console_messages |
| Memory | 14 | Category on, 13 need --memoryDebugging |
Three snapshots, comparison, retaining paths |
| Extensions | 5 | Off (--categoryExtensions) |
Not used |
| Third-party 2, WebMCP 2 | 4 | Off (a dedicated flag each; WebMCP needs Chrome 150 or later) | Not used |
| PWA | 4 | Off (--categoryPwa, pipe connections only) |
Not used |
The debugging category also has lighthouse_audit, which this article did not use. It audits accessibility, SEO, best practices and suitability for agents, and it leaves out performance, so the trace tools above handle performance. If there are too many tools and the context feels heavy, there is --slim. It exposes only three tools, navigate, evaluate and screenshot, and suits jobs at the level of “open it and take one look.”
There is also a way to call the same tools from a terminal without an agent. Install with npm i chrome-devtools-mcp@latest -g and a chrome-devtools command appears. On the first call a background server and browser start automatically, and later commands keep using the same browser. Page-level tools take a pageId as the first argument. Headless isolated mode is the default, and results come out as a readable summary, or as raw JSON if you pass --output-format=json.
chrome-devtools new_page "https://example.com"
chrome-devtools take_screenshot 1 --filePath screenshot.png
chrome-devtools lighthouse_audit 1 --mode snapshot
chrome-devtools stop   # shut down the background server and browser
Besides debug-optimize-lcp and memory-leak-debugging, used in this article, the skills are chrome-devtools (basic usage), chrome-devtools-cli, a11y-debugging, cookie-debugging and troubleshooting, seven in all. The README says the skills are paired with the server version, so update the skills again each time you upgrade the server or the CLI. An outdated skill can tell the agent to use tools or arguments that have since changed.
What to decide before turning it on: profile, addresses, statistics, config file
Everything this tool does is another face of “opening everything inside the browser to the agent.” The disclaimer item in the README says the contents of the browser instance are exposed to the MCP client, which can inspect and modify the data inside. The network request tools return headers and bodies, and their descriptions mention Cookie and Set-Cookie, so it is right to assume credentials can pass to the agent as they are. --redactNetworkHeaders, which masks them, is off by default.
First decide which Chrome to attach to. The default is for the server to launch a new Chrome with a dedicated profile, and --isolated uses a temporary profile that is deleted on exit. There are two ways to attach to your own running Chrome. --autoConnect requires Chrome 144 or later, remote debugging turned on at chrome://inspect/#remote-debugging, and clicking Allow in the permission dialog; every open window of the default profile becomes visible to the agent. --browser-url=http://127.0.0.1:9222 attaches to a Chrome launched with a debugging port, and the docs warn that while the port is open, any local app can control the browser. It is safer to keep it apart from your everyday profile with a separate --user-data-dir and not open sensitive sites in it.
Next are the server-side control options. Organized by the configuration options document, they are as follows.
--blockedUrlPatternblocks navigation and sub-requests to matching addresses, and--allowedUrlPatternallows only matching addresses (Chrome 149 or later).- Turning off
--fileNavigationsblocks navigation tofile:addresses. It is not a file system sandbox, so full isolation needs a separate operating system sandbox. - Turning off
--javascriptEvaluationblocksevaluate_scriptandjavascript:anddata:navigation, but the page’s own scripts keep running. The LCP diagnosis in this article usesevaluate_script, so keep it on for diagnostic sessions. --filesystemRoot(--workspace) sets the folder the file tools can access, and the default is the operating system’s temp folder.- Turning on
--experimentalDevtoolslets the agent automate the DevTools UI (including the console), and--javascriptEvaluationcannot block this route.
Options can also be given in a JSON config file instead of command-line arguments. The search order is the --config path, then the plugin data folder when running as a plugin, then the global file (~/.config/cd4a/config.json on Mac and Linux); only the first one found is used and they are not merged. With --watchConfig, introduced in 1.12.0, editing the file applies address patterns and tool categories without restarting the server. However, tabs that were already open stay attached even if they violate the new pattern.
{
  "headless": true,
  "isolated": true,
  "blockedUrlPattern": ["*://*.example.com/*"],
  "usageStatistics": false,
  "performanceCrux": false
}
The config file itself is the weakest link. The file sets the executable path, Chrome arguments and address patterns, so the docs warn that if the agent can edit this file (or the path given with --config), it can lift the restrictions on its own. Put the file and its parent folders where the agent cannot write.
Three values go outside. Usage statistics are collected by Google (tool call success rate, latency and environment information), on by default, and you turn them off with the --no-usage-statistics argument or the CHROME_DEVTOOLS_MCP_NO_USAGE_STATISTICS environment variable. They turn off automatically if the CI environment variable is present, and are separate from Chrome’s own statistics setting. The CrUX lookup we saw earlier is turned off with --no-performance-crux. The npm new-version check is turned off with CHROME_DEVTOOLS_MCP_NO_UPDATE_CHECKS. Officially supported browsers are only Google Chrome and Chrome for Testing, and other Chrome-based browsers are not guaranteed to work.
- Confirm the Chrome you attach is dedicated to this work (not a profile logged in to banking, email or internal tools).
- Block addresses that are not inspection targets with
blockedUrlPattern, and build an allow list withallowedUrlPatternif needed. - Decide whether to turn off statistics and CrUX, and write it in the config file or arguments.
- Confirm the config file location is outside the agent's write scope.
- If you use the skills, update them together whenever you upgrade the server version.