AI agents dissect apps, so how far to trust 390K-star REA?
REA, past 390K GitHub stars, gives coding agents reverse-engineering tools. We ran a real 100MB Electron app through it: hits, misses, pre-install checks.
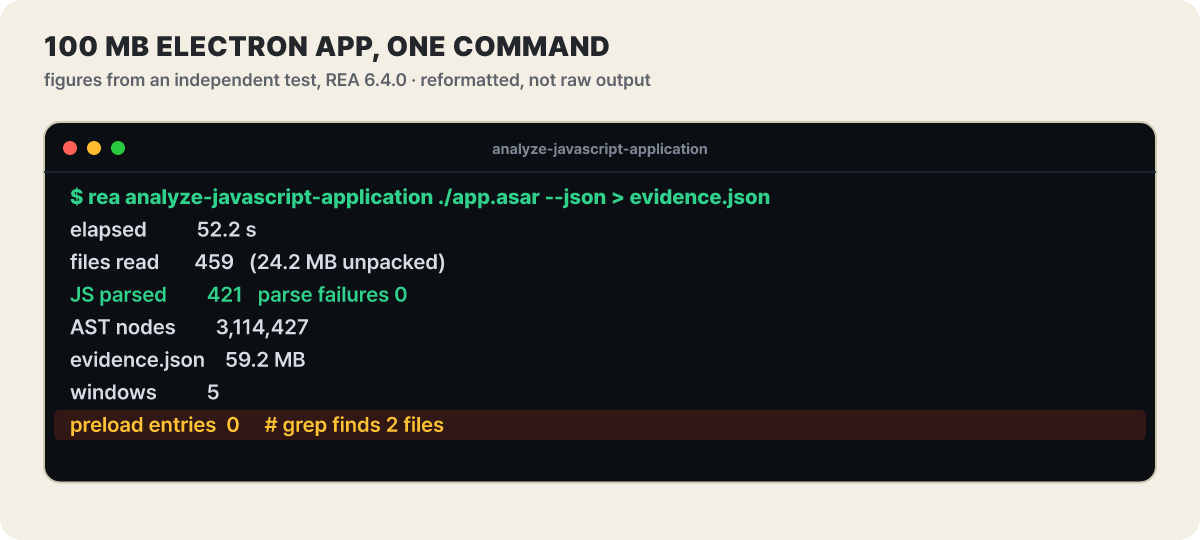 Figure 1. The numbers from one developer’s independent test (REA 6.4.0), laid out like a terminal. Not the raw output
REA read 459 files of a 100MB app in 52 seconds and parsed 421 JavaScript files without a single parse failure, and then the last line goes wrong. It reported 0 preload entry points, yet grepping the same app turns up 2 files. REA (Reverse Engineer Anything) is an MCP server and CLI that lets an AI agent analyze a program without source code. This article uses that test as a guide to walk through analyzing one real app and how far to trust the result. The repository was created on April 14, and according to one analysis it still had fewer than 10,000 stars on October 7, but the GitHub API on the 27th (UTC) shows 389,435 stars and 97,557 forks. Releases have been just as fast: eight in 17 days, from 6.1.0 on October 9 to 6.8.0 on the 25th.
A front desk, not a decompiler
This is not a new reverse-engineering technique. Turning machine code back into code people can read is a decompiler’s job, and Ghidra, IDA and Hopper already do it. REA is the front desk ahead of them: it takes the agent’s request, passes it to an engine, and returns the organized result. The agent makes calls over MCP (the common protocol AI agents use to call external tools) such as “give me the pseudocode for this function,” then reads the evidence it gets back to explain the code or implement a similar feature. If the implementation does not match, it orders another investigation, and the loop keeps turning.
What sets this tool apart is the label attached to each result. According to the documentation, an evidence record carries the target’s identity, the source location, what was observed versus what was inferred, unresolved items, confidence, limits, and coverage, which says how much of the target was examined. When two results are compared, an item present on only one side is not declared “absent” but left unresolved. If you save an analysis as a snapshot, it is reused only when the target bytes, the task and the settings are all identical, and the snapshot file is kept locally, readable by its owner only. As the next sections show, if you do not read that label, you get fooled by results like the 0 above.
Some targets REA reads itself, others need an engine you install
What you must prepare depends heavily on what you are analyzing. The figure below splits the README’s target table into what REA reads straight from files and what needs an engine. The green area at the top covers targets that need only Node.js or whose format REA interprets itself, and the amber area at the bottom covers targets where you must supply the engine.
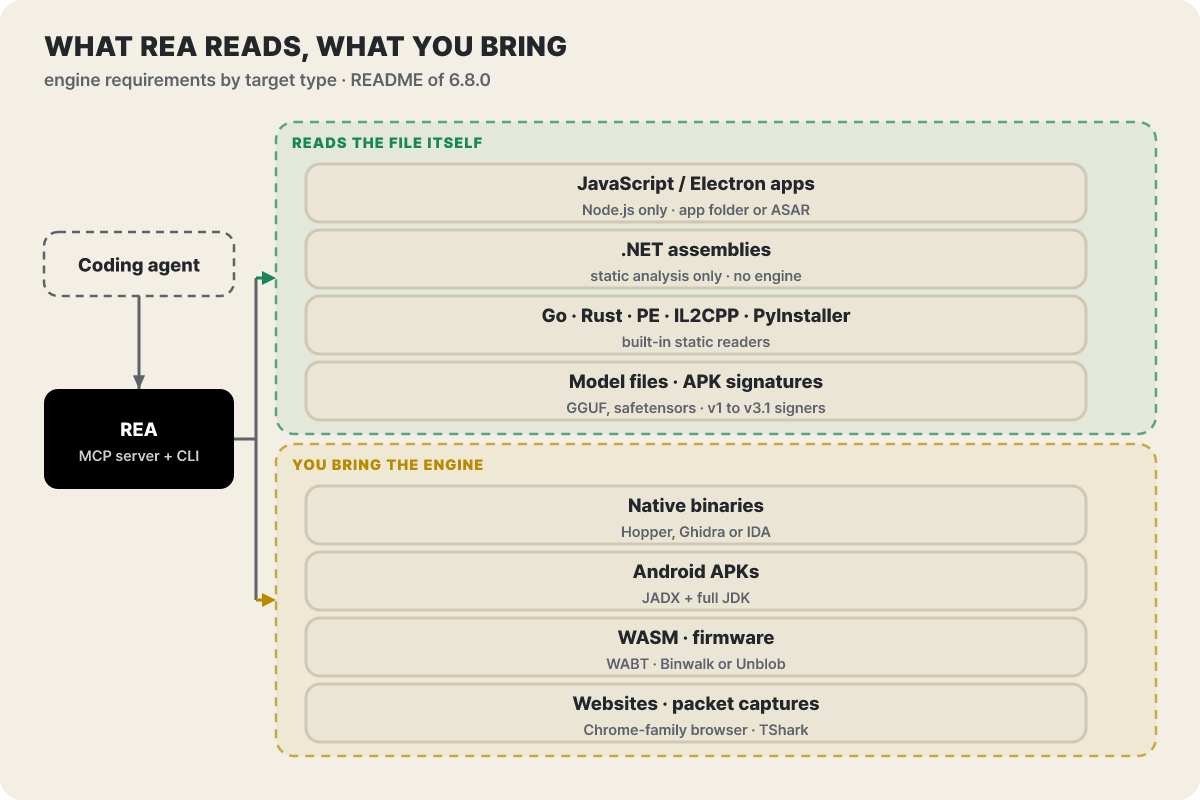 Figure 2. Top: targets REA reads directly. Bottom: targets where you prepare an engine separately
The README table got much longer in 6.8.0. It now includes formats such as GPU code objects, Erlang BEAM, Unity IL2CPP metadata, Godot PCK, SQLite, Linux crash records and logic-signal captures. Narrowing it to the targets with demanding prerequisites gives the table below.
| Target | What you get | What you prepare |
|---|---|---|
| Native executables | Functions, strings, references, call relationships | One of Hopper, Ghidra or IDA. setup can install Hopper after approval; Ghidra and IDA use an existing install |
| Android APKs | Manifest, classes, decompiled methods | Headless JADX and a full JDK |
| WASM | Sections, imports and exports, WAT | WABT 1.0.42 |
| Firmware | Regions, extraction results | Binwalk or Unblob (Linux) |
| Websites | Page structure, scripts, observed requests | A Chromium-family browser |
| Network captures | Requests, responses, exposed payloads | A HAR or Fiddler SAZ file |
| JavaScript and Electron apps | Modules, imports, routes, IPC, native add-on relationships | Node.js and the app folder or an ASAR (on Linux, a procps-compatible ps) |
| .NET assemblies | Metadata, CIL instructions, build-to-build comparison | Nothing (static analysis only) |
The side that needs no engine also carries less execution risk. Static JavaScript and .NET analysis only reads files and never runs the target. By contrast, process and browser capture and Android device control actually run the target with your user permissions or change the connected device. When several engines fit the same target, pick one with --provider, and see which engines were detected with rea providers --json.
Read what setup writes before you install
Before installing any tool, it is safer to know what it writes into your configuration files. The project says its only official sources are the morluto/rea repository, rea.tools and the rea-agents npm package, and that similarly named repositories and copied READMEs are not official. Check Node.js first. The supported range is 22.x (22.23.4 or later), 24.x (24.22.1 or later) and 26.12.1 or later; the 6.8.0 release notes state flatly that Node 23 and 25 are not supported, and the installer does not upgrade Node for you.
- Look at the plan in read-only mode first. It changes nothing and only prints which files would change and how.
- Diagnose whether your environment is ready. This command is read-only too.
- If you are happy with the plan, run the real setup. You choose the agents you use, then review and approve the install plan (changed file paths, the changes, required external software, and the package commands to run). Hopper installation asks once more separately, and Claude Desktop must be fully quit before you approve, because a running app can overwrite the registration.
- Restart the agent.
rea setup --client codex --client cursor --skill=false --dry-run
rea doctor --json
npx rea-agents setup
According to the documentation, setup writes an MCP server entry into each selected agent’s configuration and leaves other entries and comments alone. For Claude Code it registers under mcpServers.rea in ~/.claude.json and installs a skill named reverse-engineer-anything in ~/.claude/skills. Existing settings are backed up as .rea.backup, and if a configuration file is broken, the whole operation stops before writing anything. To register by hand, you can attach it to a single project only, and the docs advise avoiding --scope project, which creates a .mcp.json in your repository.
claude mcp add --scope local rea -- npx -y rea-agents@6.8.0 mcpThere is also a skill-only route (npx skills add morluto/rea --skill reverse-engineer-anything), but it installs only the instructions and reference material, not the MCP server or any analysis engine. To update, run rea update (only if you installed globally with npm or Bun), then approve the configuration plan it prints and restart the agent. If you use it through npx, run npx rea-agents@latest setup. Remove it with rea uninstall, and adding --purge-data also deletes the cache and state in ~/.rea. Hopper, Node.js, any evidence files you collected, and other MCP servers stay in place.
The documentation also lists the places where the engine side tends to get stuck. Ghidra needs its install path in GHIDRA_INSTALL_DIR (12.1.x, verified on 12.1.4) and a 64-bit JDK 21 or later in JAVA_HOME, and the default startup limit is 330,000 ms. Raise it with REA_GHIDRA_STARTUP_TIMEOUT_MS for large files. On macOS, Hopper’s first-launch demo and license dialog has to be handled first in the same user session, and Ghidra support on Windows is experimental.
Feed it a 100MB app and wait 52 seconds
Now the analysis itself. If the target is your own Electron app and you have the extracted folder or the ASAR file, you can run it from the terminal in one line. It reads only the files without running the app, and it leaves the result in a file.
npx -y rea-agents@latest analyze-javascript-application /absolute/path/to/app --json > app-evidence.jsonThe test above (Debian 13, Node 22.20, REA 6.4.0) analyzed an app.asar of about 100MB this way. From 459 files it read 421 JS files and built 3,114,427 AST nodes with zero parse failures, in 52.2 seconds. The result JSON was 59.2MB, and even the response to a single summary call was about 1.35MB. Feed an agent that response whole and its conversation window fills fast. That is why the 6.8.0 release notes stress archived summaries and selective queries for big investigations. With inspect_analysis_view you pull just the module list or chosen facts from an analysis that has already finished, page by page (64 rows by default), and you can export the full evidence separately. In the same release analyze_function now returns only a summary by default, and if you need the old full report, specify detail: "complete".
The documentation attaches a warning to this way of querying. An empty page, or having paged to the very end, does not prove that something is “absent” from an app that was only partly analyzed. In the test, too, 365 of the 744 connections were dropped by the result size limit. When you read results, look at the coverage and limits fields before the counts.
Counting again with grep leaves one line empty
Setting the counts REA and grep each produced for the same app side by side shows where to trust it and where to doubt it. In the bars below, equal lengths mean a match, and only the last row differs.
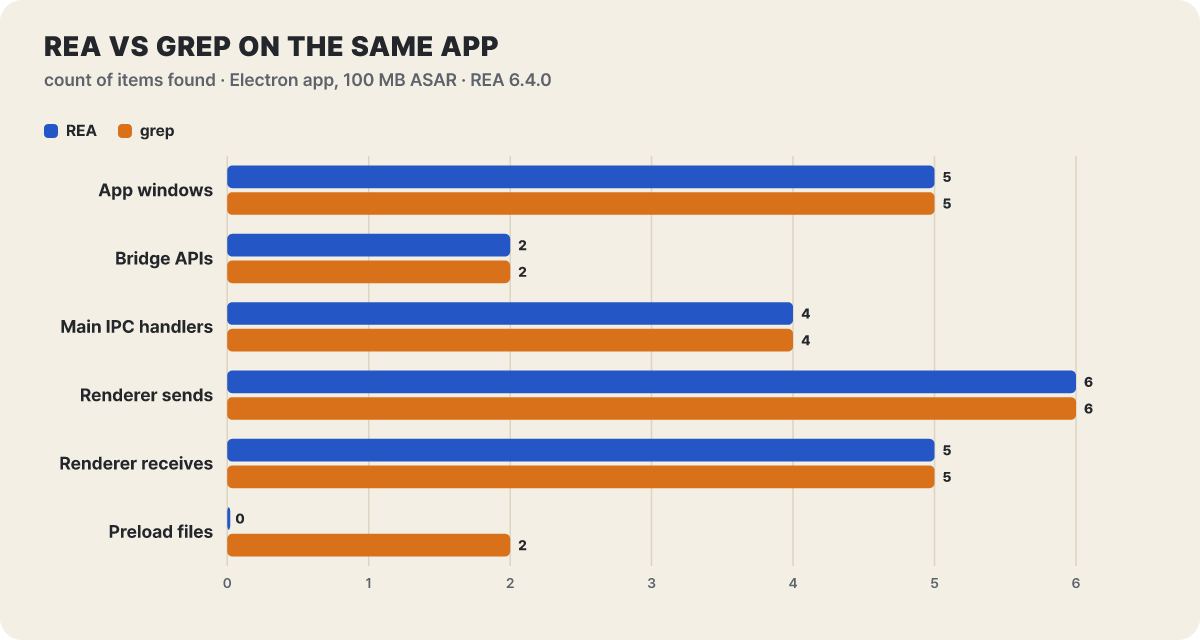 Figure 3. Windows, bridges and IPC match; the preload files do not. Source: the developer’s independent test, REA 6.4.0
The 5 app windows, 2 bridge APIs, 4 main-process IPC handlers, and 6 sends and 5 receives on the renderer side matched grep, and a toy app with compressed, obfuscated code gave the same result. It was wrong in two places. Because it counted 0 preload entry points, exposed API members came out as 0, and a trace following one channel returned an empty result even though that string is plainly in the source. More worrying, it reported 0 for two sender checks hidden behind a helper function in the toy app. Sender validation is a core checkpoint in Electron app security, so you should not trust the output alone for this item. REA itself warns that “no match” does not mean “absent,” but heeding that warning is up to the reader. These figures are for 6.4.0 and may have changed in later releases, so count again yourself on your own app.
One clipboard copy, all the way to the main process
So what does REA show when it does find things? A Notion desktop case the project published (app 7.6.1, REA 4.1.0) asks how, when the copy button is pressed, text and HTML get to the system clipboard. An Electron app splits its renderer code from its main-process code, and a preload (bridge code exposed to the page) and IPC (inter-process communication) connect the two. In the figure below, the green arrows are the stretches where REA located the code, and the amber one is a stretch a person joined by reading code.
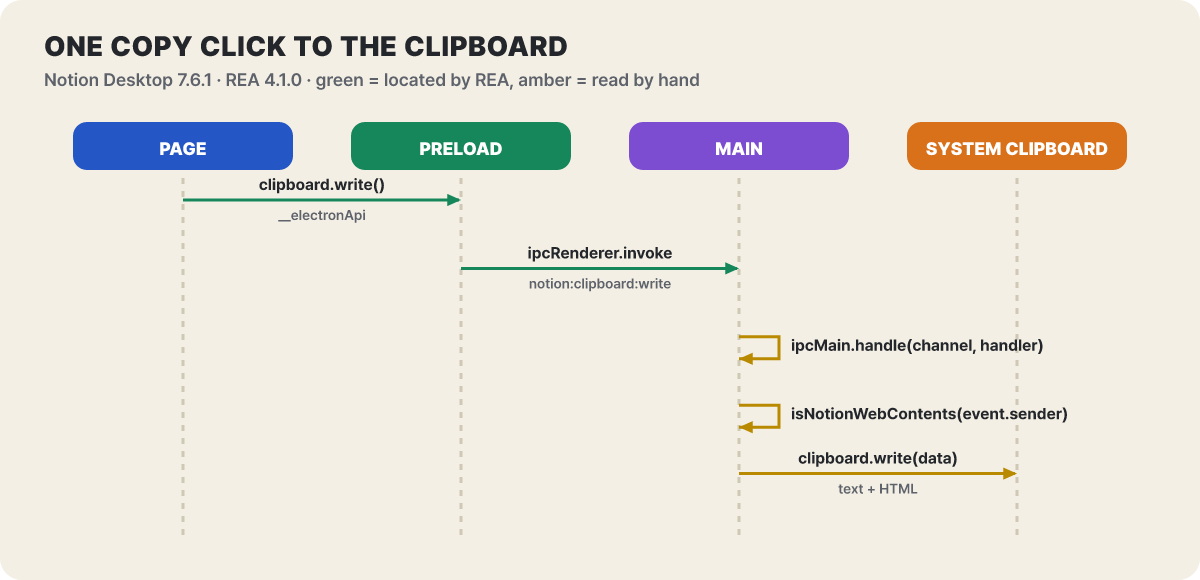 Figure 4. REA found the exposed API and the call site; connecting them to the main-process receiver was done by hand
The write-up states its own scope of verification. What REA found was __electronApi, exposed to the page, and the ipcRenderer.invoke call site (the channel is named notion:clipboard:write). Linking that to the main process’s ipcMain.handle receiver was confirmed by a person reading the bundled code. The main process writes to the clipboard only after confirming with isNotionWebContents(event.sender) that the caller is a Notion page. The behavior, too, was checked with saved modules and a small test harness, not on a real desktop screen. What makes the case worth reading is that the copied HTML contains a copy ID, and on paste the app uses that ID to find its own block data and rebuild the structure; if no record matches the ID, it pastes as plain text and HTML. Combined with the previous section’s test, the conclusion is the same. REA opens the road, but the person verifying has to join the last seam.
The Calculator % button and dinosaur speed, short cases in the same style
The project has published a few more cases that can be checked against numbers. All are presented against REA 4.1.0, and each states how far it was verified, which makes the figures easy to read.
- The % button in Windows Calculator. The question was “why is 200 + 10% equal to 220,” and the rule was found by reading the handler in 11.2508.4.0 (x64). After addition, % is a share of the first number, so it adds 10% of 200, which is 20. After multiplication or division, % is the second number divided by 100, so 200 × 10% is 20. The result is said to have been checked against the source and tests Microsoft published.
- The Chrome dinosaur game. Speed starts at 6, rises by 0.001 on each update without a collision, and stops at 13. Going from 6 to 13 takes 7,000 updates, and in a cross-check the original update function reached 10.0 after 4,000 updates and 13.0 after 10,000.
- How the 1996 game DX-Ball pans its sound left and right. When
analyze_functionopened the function, the pseudocode did not show the input, but reading the instructions revealed that the input is converted from the stack ([EBP+8]) to a floating-point number and then multiplied and subtracted. The caller computes20 + 30 × tile_xfrom the brick position and passes it in, andread_bytesread the constants 1.5625 and 500.0. The reconstructed C code gives -500 at the left edge (0), 0 at the center (320) and 500 at the right edge (640) when the scale is 1.
DX-Ball’s verification runs on two tracks. The original x86 and the reconstruction were run side by side on 3,205 inputs (integer positions 0 to 640 with five scales) and compared, and 63 bytes of the function recompiled with the same compiler version matched the original after accounting for the reviewed relocations. The important moment is when the pseudocode failed to show the input and the work dropped down to assembly. It means this is not a tool that restores original source, but one where the agent understands and implements behavior from pseudocode, assembly and module relationships as evidence. The README also describes a case that uses a clock to show why the 6-digit code in the Android authenticator Aegis APK changes every 30 seconds, and a guide to rea environment-build, which builds environments for training agents from a web app session recording (HAR).
The price of 170 tools: the context the agent carries
The load placed on the agent can also be measured in numbers. In the test, REA had 170 tools, the tools/list response was about 1.95 million bytes, and with compressed schemas about 1.77 million bytes. That is how much can end up in the agent’s context. From 6.8.0 the input schema is compressed by default, and you turn on the full guidance with REA_MCP_INPUT_SCHEMA_PROFILE=full. If your client limits the size of the whole tools/list frame, you can shrink the output schema with REA_MCP_OUTPUT_SCHEMA_PROFILE=compact or off.
Money splits three ways. REA itself is free under the MIT license. Licenses for commercial engines such as IDA Pro, Hopper and JEB are not provided by REA, so you obtain them and follow the vendor’s terms (including trial limits on automation and sharing results), and the cost of running the agent is billed separately by the model provider. Factor in that many tools return large responses, which can raise token usage.
On “is it better with REA,” there are two anecdotal comparisons. In a video experiment by an AI service company and a developer, an agent using REA and one without it each built a clone of the macOS Preview app, and the REA side felt closer to the original while the non-REA side finished first. Both were unofficial single runs and the elapsed times were not published. The assessment was that the gap was narrow on a simple app and that REA may help more on complex software.
There are other options. GhidraMCP (LaurieWired) is under Apache-2.0 with 11,578 stars, and it exposes Ghidra’s features, such as renaming functions and extracting method and import lists, over MCP, with a Ghidra plugin and a Python bridge installed separately. Its last push was October 10. If Ghidra alone is enough and you only need the agent connection, this one is lighter, whereas REA gathers many engines and formats in one place, so there is more to install and the results are bigger. To make just the look of an app with a simple screen, a general agent that uses only screen capture and inference can do it, and for the hardest code or work where responsibility for the result is at stake, it is better for a person to handle Ghidra or IDA directly.
Apps you may analyze and apps you may not
The project’s DISCLAIMER spells out the supported and unsupported uses. The supported side is security research, malware and incident analysis, vulnerability research under coordinated disclosure, CTFs and education, interoperability, software preservation, and inspecting or debugging software you own or are authorized to analyze. The unsupported side is circumventing DRM, license checks or anti-cheat; cloning protected code and assets; bypassing authentication or access controls on systems you are not authorized to touch; building game cheats and tampering with online services; and evading AI vendors’ usage policies or reselling AI accounts and APIs. It also says that requests for unsupported uses are closed without an answer in issues and discussions, and the requester may be removed from the community.
Here is how that line applies to your situation.
| Target | Verdict |
|---|---|
| An app you built, your company’s product | Fits pre-release checks and understanding old tools whose source is lost |
| A customer’s software under a contract or written permission | Only within the permitted scope. Running or collecting beyond it is outside your authority |
| Copying another company’s commercial app’s screens and behavior as is | An unsupported use for the project, and it can raise intellectual property problems |
| Executables of unknown origin | Only inside an isolated virtual machine. Analyzing and running are different things |
The DISCLAIMER stresses that having a file, or access to a debugging port, does not by itself permit every action. It also lists it as the user’s responsibility to protect credentials, personal information and captured traffic that analysis turns up, and to get permission before collecting or sharing them. One news report said the tool has prompted more attempts to swap out the default software on smart TVs or strip device ads, and pointed out that sloppy replacement software installed on important equipment can put the device and the network at risk.
Permission depends on the agent’s approval. REA does not ask for separate confirmation on each action and leaves that to the MCP client. Some tools actually run the analysis target or change a connected Android device, and the markers that flag this (destructive-tool hints) are only hints for the client, not access control. Also, the analysis runs locally, but the one receiving the tool results is the agent, so the pseudocode and strings fall under the data policy of the model vendor that agent uses.
The order for running the same check on your own app
The test above is exactly the kind of use that lowers the cost of checks for the defending side. Here is the order for sweeping the exposure of your own Electron app before release, written to fit the lessons of that test.
- First confirm that the target is yours, and if files of unclear origin are mixed in, run it in a virtual machine or an isolated account.
- Run the one
analyze-javascript-applicationline from earlier and keep the result in a file. The app is not run. - Count the windows, bridge APIs and IPC handlers in the result once more with grep. If the values differ, start by reading the code on the side that disagrees.
- If the preload count is 0 or the exposed API is empty, first check whether there is truly nothing or the analysis missed it. Read the coverage and limits fields of the result as well.
- Have a person read the sender checks in the code directly. There is a case where the tool missed a check hidden behind a helper function.
- In the agent's approval settings, set execution-type tools (process and browser capture, device control) to ask every time.
The same tool is also used for supply-chain checks. It can read the embedded information of a Go or Rust binary you received without any engine and pull out the compiler version, modules and the list of dependent crates, and for Rust it reads the information embedded in binaries built with cargo-auditable. On the signing side, it reads PE certificates and the list of imported DLLs, and the v1 to v3.1 signers and certificate fingerprints of an APK. Comparing security updates has also gotten easier. An agent can take on patch diffing, which finds what changed between two versions, and REA has a tool for comparing app versions and sources or bundles (compare_application_versions). One analysis noted that faster comparison can shrink the gap between a fix being published and its exploitation, so defenders should assume that speed and not put off applying security updates. Assume that someone will read any app you ship, and remove secret values, bundled source maps and the scope you opened over IPC before release.