Graphify makes agents ask a graph, not dig through files
A teardown of the graph Graphify builds: nodes, links, EXTRACTED and INFERRED tags, five score steps, per-input paths, queries, updates, logs and benchmarks.
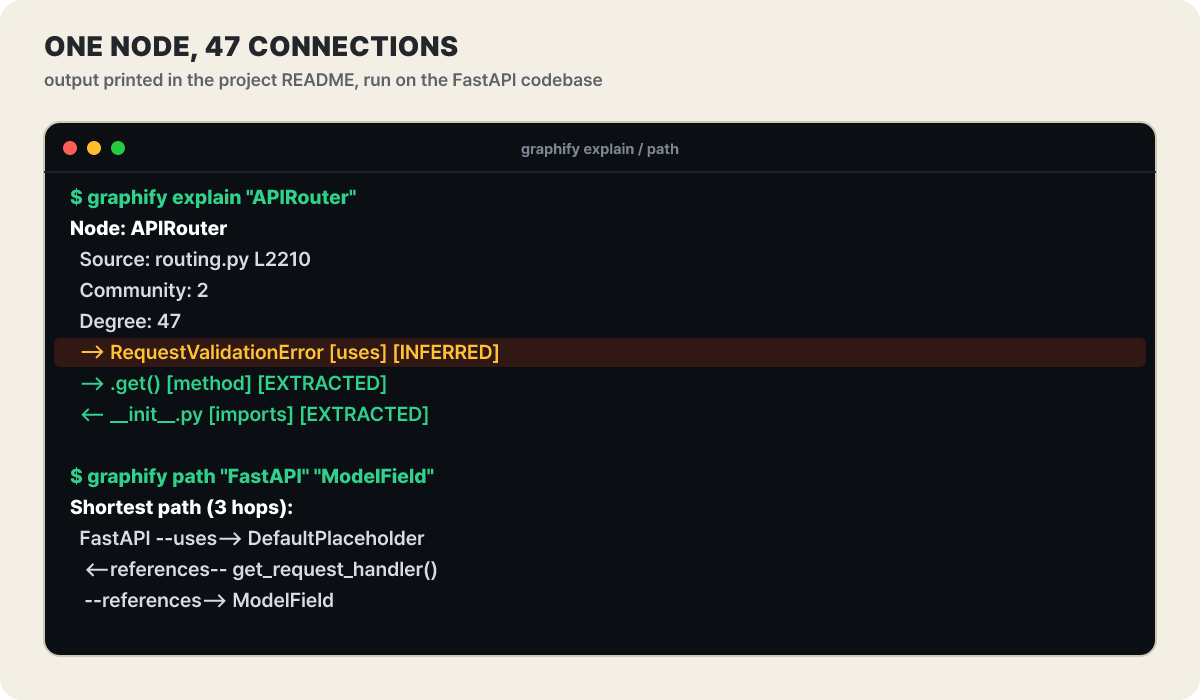 Figure 1. Real output from the Graphify README. On a graph built from the FastAPI repository, it explains one node and finds a path between two nodes
The screen above is everything Graphify hands back to an agent. It is not file contents but a name, a location (routing.py L2210), a community number, a connection count (Degree: 47) and a list of links. The arrow direction says who calls or imports whom, and the tag at the end of each line says how that fact was learned. The yellow uses is a relationship worked out by interpretation (INFERRED); the green .get() and imports are relationships written directly in the source (EXTRACTED). The path query below it found a route of three hops from FastAPI to ModelField, and it is worth noticing that the arrow direction flips once along the way. This article takes that single piece of output apart part by part, to see what it is made of and how far it can be trusted. Graphify is open source released by Graphify Labs under Apache-2.0, and you use it either as /graphify inside a coding agent or as the graphify command in a terminal. As of Oct 27, 2026 (UTC), the latest PyPI release is 0.9.96, uploaded on Oct 26 at 15:18, and there have been 264 releases since the first upload (0.1.1) on Apr 4. The repository has 135,857 stars and 12,959 forks.
Nodes, links, direction, communities: counting what is in the graph
The graph has four kinds of parts. The table below gives their names and uses first, then points out which line of Figure 1 is which part.
| Part | What it is | In Figure 1 |
|---|---|---|
| Node | One concept. There are five kinds: code, document, paper, image and rationale. Each has a label and a source file and line number | APIRouter, Source: routing.py L2210 |
| Link | A relationship joining two nodes: calls, imports, inherits, mixes_in, uses, references, method, semantically_similar_to and so on |
[uses], [method], [imports] |
| Direction | A calls B and B calls A are stored as different relationships |
The right and left arrows at the start of each output line |
| Community | A group of nodes tightly connected to each other. Split with the Leiden algorithm and named without a model | Community: 2 |
Two kinds of nodes get special names. The concept with the most connections is called a god node, and APIRouter in Figure 1 holds that spot with 47 connections. Rationale nodes are made from # NOTE: and # WHY: code comments and from ADR and RFC citations, and they attach to the code in question. On the link side, hyperedges, which tie three or more nodes together at once, are stored separately. The storage format is NetworkX’s node-link structure, and the file records its schema version and the Graphify version that produced it. The documentation warns that fields can differ between extractors and releases, so read only the fields you need and never assume every node is a function or every link has a line number.
It helps to have a sense of scale too. The benchmark document charted ERPNext, a Python repository of about a million lines, across 689 weekly checkpoints from June 2011 to June 2026. Using syntax parsing alone, with no model, the first checkpoint had 3,069 nodes and 2,900 links, and the last had 22,620 nodes and 48,710 links. Over 15 years nodes grew about 7 times and links about 17 times. Links growing faster than nodes reads as the tangle between parts rising more steeply as a project gets bigger.
Five lines that turn a folder of three functions into a graph
Trying a small example is the quickest way to see it. The official first-graph guide uses a one-file Python project and does not even require an API key. Create app.py in an empty folder.
def normalize_email(email: str) -> str:
    return email.strip().lower()


def find_user(email: str) -> dict:
    return {"email": normalize_email(email)}


def login(email: str) -> dict:
return find_user(email)- Install with
uv tool install graphifyy(pipx install graphifyyalso works. Note that the package name has two y's) - Extract code only, from the same folder.
graphify extract . --code-only - Cluster without a model and build the view.
graphify cluster-only . --no-label, thengraphify export html - Ask with
graphify path "login" "normalize_email". The answer the guide expects is a path fromloginthroughfind_usertonormalize_email - Change one line of code, update with
graphify update ., then ask the same question again and compare whether the connections changed
Figure 2 draws what this folder looks like as a graph. The three functions in the green area and the two calls links are the structure that appears in the tutorial above. The document node in the yellow area on the right and the dotted links are a made-up example added by the editors to show all three kinds of tags on one screen.
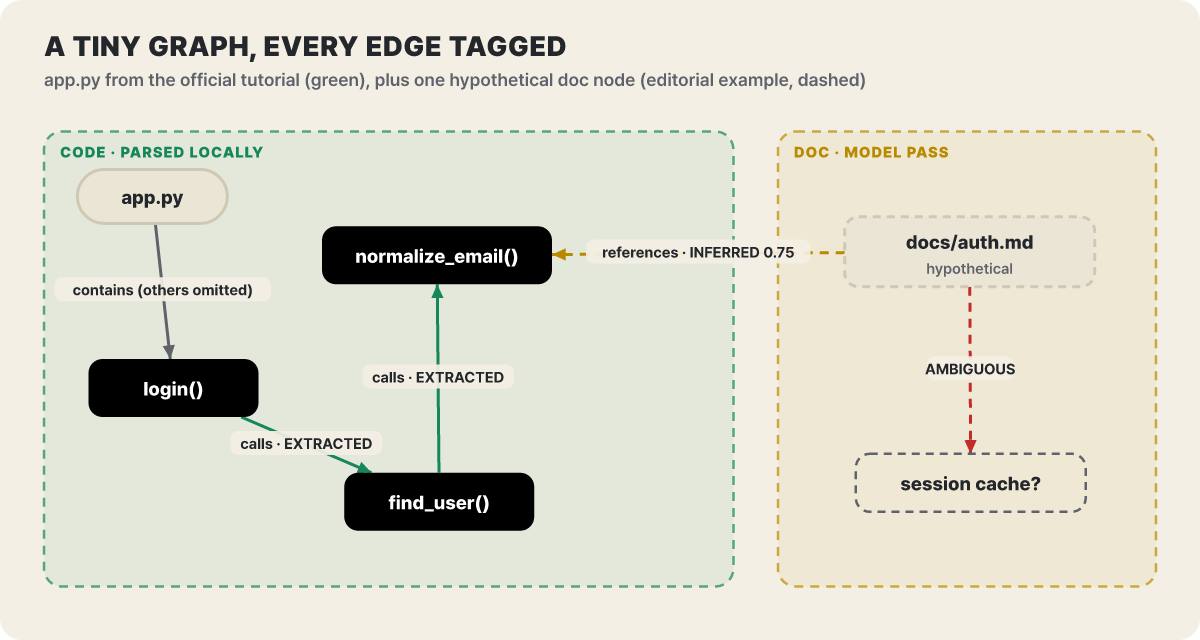 Figure 2. The code area is built by syntax parsing alone and gets EXTRACTED; the document area is read by a model and then gets a score or AMBIGUOUS (the document node is the editors’ made-up example)
In the figure, the color and shape of a link are its level of trust. A solid green line is a fact read straight from the source, while a dotted line is an interpretation or a hold. INFERRED can also appear inside the code area, which a later section covers.
Three link tags and five score steps
The most useful design in Graphify is that every link carries an answer to “how did we learn this?” The official definitions are as follows.
- EXTRACTED: the relationship is stated explicitly in the analyzed source. Confidence is fixed at 1.0, and you can follow the source location to confirm it
- INFERRED: a relationship derived by resolving names or imports, or by semantic analysis. It can also arise from static interpretation alone, with no model. You look at the evidence and score and decide whether to accept it
- AMBIGUOUS: the evidence cannot settle on a single relationship. It is flagged in the report and a person has to look at the source directly
It would be a mistake to read INFERRED as “something the model made up.” The score does not run continuously; it falls into five steps.
| Score | When it applies |
|---|---|
| 0.95 | There is an explicit reference between files and only one plausible target |
| 0.85 | The name and context line up |
| 0.75 | Reasonable in context but not stated |
| 0.65 | Nothing more than a similar name |
| 0.55 | A guess |
Fixes that keep this standard from loosening arrive with each release. Version 0.9.95 on Oct 23 changed a call that reached a same-named symbol merely because the same module was imported so that it stays INFERRED instead of being promoted to EXTRACTED. The change is meant to stop the wrong side from being marked as certain when functions of the same name exist in two files. In 0.9.96 on Oct 26, a Python run() call no longer attaches to a look-alike _run() and attaches to the method spelled exactly that way, and a call through a field injected by the constructor is linked as INFERRED only when the target resolves to a single one.
So how often is INFERRED right? The benchmark document carries one dated spot check. On Oct 5, every cross-file INFERRED link with both a start and an end point inside FastAPI’s fastapi/ folder was verified by hand, and all 12 were correct. The document itself says this is a one-time check rather than ongoing measurement, and adds that calls gets noisier when the test folders hold many helper functions with the same name. Twelve is too small a number to talk about accuracy, but it reads fine as a case of the tags working as intended.
A different road for each input: code stays, documents leave
There are three routes for building the graph, depending on the type of input. This split decides both cost and what leaves your machine.
- Code is parsed with tree-sitter, which pulls functions, classes, imports and calls for about 40 languages locally. No model is used. From 0.9.95, YAML also has its key structure extracted like code, so Kubernetes manifests and CI configs come in as nodes
- Video and audio are transcribed locally with faster-whisper, and the result is cached
- Documents, PDFs and images are handled by a model that extracts concepts and relationships. Chunks are processed in parallel and then merged into one. PDFs need the optional
pdfpackage, Word and Excel needoffice, and video and audio needvideo
A folder with only code skips the third route entirely. That is why the graph can be built offline without an API key, and the README’s “zero LLM credits for graph generation” refers to this case. Once documents are mixed in, only that part is handled by a model. With /graphify inside an agent, the session’s model does the work; with graphify extract in a terminal, the provider of the key found in the environment variables does. The provider is chosen automatically, in the priority order Gemini, Kimi, Claude, OpenAI, DeepSeek, Azure, Bedrock, Ollama, so if several keys are present in the environment an unintended provider can be selected. Fortunately it prints the variable name that was chosen, and to pick one yourself you use –backend or GRAPHIFY_BACKEND. If Claude Code is installed, there is also a way to use your subscription without an API key through the claude-cli backend.
If sending documents to a model is a problem, there are three ways to turn that off. –code-only processes only code, and GRAPHIFY_BACKEND=none turns off every model backend. If you need document semantics but nothing may leave the machine, –backend ollama runs the semantic extraction locally. Files with identical content are told apart by a SHA256 fingerprint and cached, so a rerun skips files that have not changed. The README states that it does no usage tracking or analytics.
Opening up the graphify-out folder
When a run finishes, a graphify-out/ folder appears inside the project. The README promises three files, and the rest are parts needed for operation.
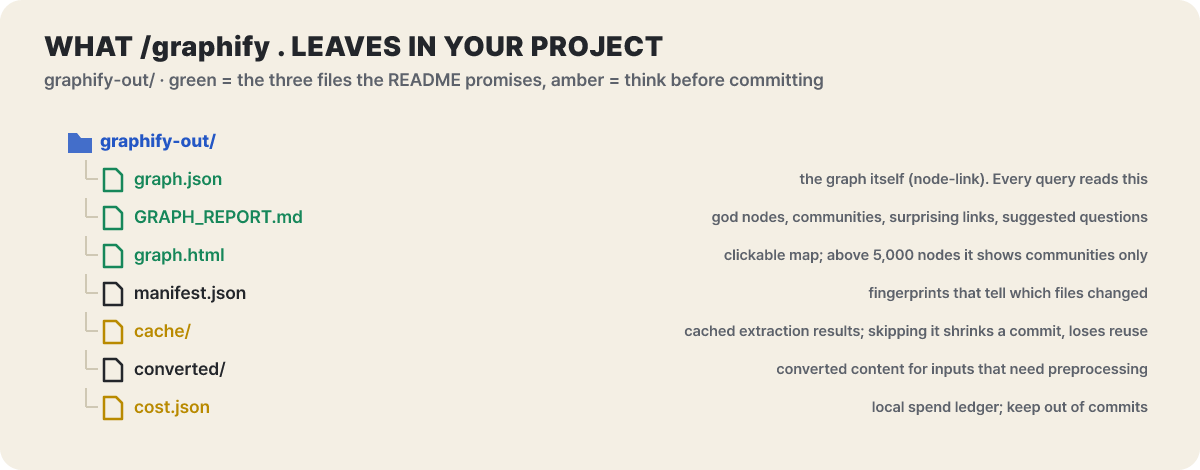 Figure 3. Queries read only graph.json; the rest are summaries for people and parts for updating
graph.json is the source for queries, so with this file alone you can ask questions without reading the source again. graph.html summarizes by community when there are more than 5,000 nodes. GRAPH_REPORT.md collects the god nodes, community makeup, surprising connections and suggested questions, and the standing guidance says to read it only when you need the broad structure and to use narrowly scoped queries for individual questions. The two files marked yellow in the figure are the ones to think about before sharing. cost.json is a local cost record, so the advice is to keep it out of commits, and cache/ can be excluded to shrink the repository, though that means less cache reuse on the next run.
If you work across several branches or split work into worktrees, use the GRAPHIFY_OUT environment variable to give each worktree a different output folder. The documentation recommends this directly, and if several branches write to one graphify-out/ they overwrite each other’s graphs.
query, explain and path ask different questions
The three commands differ in the shape of the question. Figure 1 showed two of them in actual use.
| Command | Question it asks | Options to know |
|---|---|---|
query |
Gathering the neighbors of one concept, such as “how do authentication and session storage connect” | Breadth-first by default, –dfs for depth-first. –budget (output token budget, default 2000), –context call (call relationships only), –graph (a different graph file) |
explain |
What is this node | Source location, community, incoming and outgoing links |
path |
How are the two connected | Follows the stored direction. To see connectivity without direction, use –undirected |
When a name matches several nodes, Graphify does not guess; it shows the candidates and refuses. The exit codes differ so a script can tell the cases apart. 0 means an answer was produced, 3 means the name is ambiguous, and 4 means no node matched.
There are two limits to keep in mind when interpreting the answers. First, a path existing does not mean execution actually travels along it. It is only a source-level relationship, so conditional calls and dynamic calls may not show up. Second, no path is not evidence that two concepts are independent, because the graph may be missing a relationship. The result of query is also graph context rather than a verified answer, and the interpretation is up to the agent. That is why the documentation recommends asking the agent to include its evidence and its uncertainty. The official guidance also says that when implementation details matter, you should open the source yourself instead of relying on the summary from explain.
What makes an agent open the graph before grep
Even with a graph in place, it does no good if the agent grabs grep out of habit. Graphify sets up three things. graphify install detects the assistant you use and registers the /graphify skill (more than 20 assistants are supported), commands such as graphify claude install turn on the standing guidance, and there is an optional MCP server. How the standing guidance works differs by platform. In Claude Code and Gemini CLI, a hook appends a line telling the agent to look at the graph first, before search-type tool calls, and the Claude Code hook gives the same notice before Read and Glob open source files one at a time. In places like Codex and Cursor, AGENTS.md or a rules file plays the same role. The hook does not block the tool call; it only adds guidance context.
Part of this guidance text changed recently. In 0.9.96 the hook wording was rewritten from imperative to a statement of fact, and the changelog says the reason was that imperative wording read to agents like a prompt injection and was ignored. The tone of the notice, in other words, decided whether the agent complied.
To connect through tool calls instead of the skill, you use the MCP server. It has 10 tools, and to check the connection you call graph_stats first and then ask with query_graph.
uv tool install "graphifyy[mcp]"
claude mcp add --transport stdio graphify -- graphify-mcp /absolute/path/repo/graphify-out/graph.json
The graph path must be absolute, because a GUI client’s working directory can differ. The README advises that when you use the skill and MCP together, you decide which graph is being queried and make one of them the primary path, and that copying the same instructions into AGENTS.md twice makes them conflict.
How fast the map goes stale, and three ways to update
The graph is just a stored file, so if you change the source and do not update, it gives answers that have drifted from the current code. There are three ways to update.
| Method | When | Good to know |
|---|---|---|
graphify update . |
By hand after changing code | Re-extracts only changed files. From 0.9.96, if the input is unchanged it skips the whole extraction pipeline and leaves the outputs untouched. In an agent chat, use /graphify . –update |
graphify watch . |
Keep reflecting file changes | Needs the optional watch package. One rebuild is bounded by GRAPHIFY_REBUILD_TIMEOUT (default 600 seconds), so a stuck rebuild does not hold the watcher |
graphify hook install |
Automatically on every commit or branch switch | It runs in the background, so a query right after a commit may briefly see the previous graph. After git pull or a merge, run graphify update . yourself |
The code path and the document path update separately. Running update on code alone does not rebuild the semantic graph of changed documents, so to reflect document changes you use /graphify . –update. If a large refactor shrinks the graph sharply, the tool warns so that it does not overwrite the existing graph, and it allows the deletion with –force only when it is intended.
The documentation also has tips for a clean first scan. .gitignore is respected by default, and in .graphifyignore you list things like node_modules/, dist/, coverage/ and *.generated.py. For a repository where an extension serves several languages (.inc, .h, .m), you need to declare it in .graphifyrc, as in language.inc=php. Otherwise the file is parsed as the wrong language without any error and only a few nodes come out. It is a silent failure: the graph looks filled in while the symbols that matter are missing, and it is the first place to suspect when the node count feels lower than expected.
What gets recorded: the query log and the graph file
It is also worth knowing where traces are left when you ask questions. The README’s privacy section says that query, path, explain and MCP calls are recorded in ~/.cache/graphify-queries.log. The changelog and the code say otherwise. Since 0.9.13 on Jul 12, this log is off by default. It changed after someone pointed out that a default of on, piling questions and corpus paths into a plain-text file outside the repository, contradicted the on-device, no-tracking policy, and the current code is the same. To turn it on, set GRAPHIFY_QUERY_LOG_ENABLE=1 (default path) or GRAPHIFY_QUERY_LOG=path. GRAPHIFY_QUERY_LOG_RESPONSES=1, which also keeps the full responses, is separate, and GRAPHIFY_QUERY_LOG_DISABLE=1 overrides every other setting and turns logging off. If you leave it on, it is best not to put secret values into your questions.
The graph file itself is also something to handle with care. graph.json holds labels and context drawn from the source, so the documentation says to apply the same access controls as the original repository. Upstream recommends committing graphify-out/ to share a starting map, but says to review the contents first. There are three ways for several people to use the same graph: commit it and share, have each person build it in their own clone, or run one shared HTTP MCP server. Either way, you need to decide who updates it and when, which revision the graph points to, and who has access.
What the benchmark table can and cannot tell you
The README’s benchmark table looks impressive on one line, but you have to read it together with the conditions. The full table is in the BENCHMARKS document. Every system was run on the same harness, the same model (Kimi K2.6) and the same budget, and the grader was compared against a second grader, with 90.6% agreement and a Cohen’s kappa of 0.81. The first condition is that these are figures the project ran and published itself. The QA accuracy on LOCOMO (300 questions) and LongMemEval-S (50 questions), which evaluate long-conversation memory, is as follows.
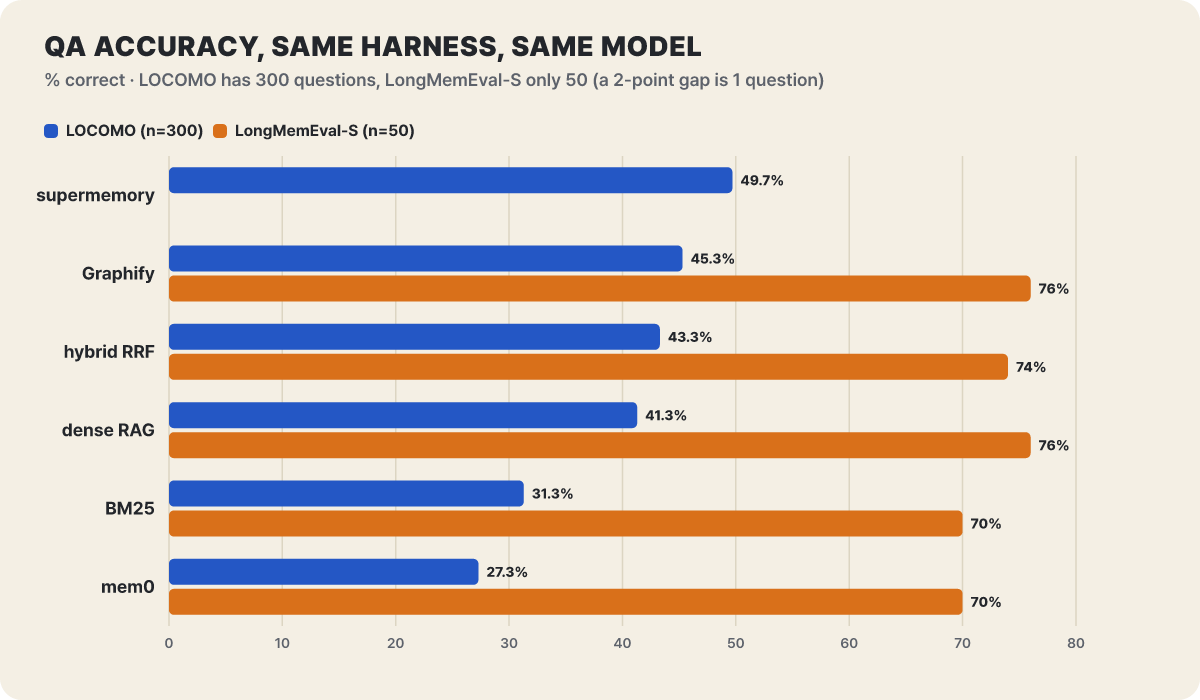 Figure 4. QA accuracy (%) measured on the same harness. The table has no LongMemEval-S value for supermemory
On LOCOMO, Graphify scores 45.3%, which is 4.4 points below supermemory’s 49.7% and 2.0 points above hybrid RRF (43.3%). On 300 questions, 2 points is a difference of six questions. The variant that expands the graph to pull in more neighbors scores 2.6 points above the variant that pulls in none (42.7%), which is the size this table lets you read as graph expansion’s share. On LongMemEval-S, on the other hand, Graphify’s 76% equals dense RAG, and on 50 questions 2 points is one question. The order in this range is hard to read as a meaningful ranking. The recall@10 of 0.497 that the promotional copy puts forward is ahead of mem0 (0.048) and supermemory (0.149), but the document says this axis is not a clean comparison because supermemory uses its own embedder, and tells you to look at QA accuracy. Hybrid RRF, searching the same index, has a nearly identical recall of 0.493. On cost the gap is clear. Ingesting the LOCOMO data cost about $1.40 for Graphify, $3.48 for mem0 and $15.67 for supermemory.
More relevant to developers is the code navigation experiment. On ERPNext, about a million lines, a Claude Opus 4.8 agent with up to 14 turns was compared using only grep, read and list tools versus one extra graph tool. The inclusion rate of key facts rose from 70.8% to 82.0%, at about 140K tokens per query. The document reports that stuffing the whole repository into context every turn costs about 20 times the tokens. There were only six questions, though, and the document itself names sample size as a limit. Read these numbers as grounds for “worth trying,” and reach your own conclusion by asking a few questions you usually ask in your own repository with and without the graph, then comparing how many files were read and how accurate the answers were.
A few places where it gets stuck
When I ask a question it says there is no answer. Is it broken?
The graph only returns relationships that exist in the analyzed input. Check that the –graph path is right and that you updated after changing the source, then ask again with a concrete name such as a function or class. Exit code 4 means no node matched, and 3 means the name matches several nodes and you need to pick a candidate.
Does building the graph cost money?
If you target only code, no model is used, so there is no LLM cost. If you include documents, PDFs or images, usage is charged to the agent session’s model or to the API key you configured. From 0.9.96, graphify extract in a terminal also records token usage in graphify-out/cost.json, so standalone extraction builds up in the cost history too.
Which file formats does it read?
Code is parsed for about 40 languages, and it also handles SQL (tables, views, foreign keys), Terraform and manifests such as pyproject.toml and go.mod. From 0.9.95, YAML structure (keys) is extracted too. PDF, Word, Excel, video and audio need the optional packages mentioned earlier.
It is a 0.9 version. Is it all right to upgrade?
Because it is a pre-1.0 version, commands, file formats and the cache structure can change with each release. The changelog repeats a sentence saying the first build after an upgrade re-extracts everything, so expect the first run right after an upgrade to take longer than usual. At a pace of 264 releases from Apr 4 to Oct 26, it is safer for a team using it together to keep versions matched.
Other roads to the same job, and the separate product that is the cloud
The opponents the benchmark actually pitted against Graphify are BM25, embedding search (dense RAG), hybrid RRF combining the two, the long-term memory services mem0 and supermemory, and the agent’s default grep and read. By approach, they look like this.
Nothing to install and always current. The bigger the repository, the higher the exploration cost, and it was the baseline in the ERPNext experiment
Good at finding text with similar meaning. You have to run an embedding store, and on LongMemEval-S it scored 76%, the same as Graphify
Services for conversation memory. On LOCOMO, supermemory has higher QA accuracy and also a higher ingestion cost
A tool in the same family. It indexes a repository into a local graph and lets you query call relationships through MCP tools
The Graphify Cloud ads repeated throughout the README are for a commercial service from the same company. Instead of a graph built on demand for each folder, it keeps an always-on graph across the whole software development process, and it advertises multi-repository and monorepo connections, PR review, format validation and Sentry and Jira integrations. As of the pricing document updated Oct 8, Free is $0 (3 repositories, 25,000 nodes per repository, 10 push-based builds a day), Pro is $15 a month ($10 a month when billed annually, unlimited repositories), Teams is $29 per seat per month (first-100-teams rate) or $40 (standard) with a minimum of 2 seats, and Enterprise is by quote. The same document states that the local CLI is free to use with no account or subscription. The README’s “80% reduction in agent token usage” line is promotion for this cloud, and the benchmark table has no entry measuring that figure, so it should not be read as the performance of the local tool. If you want to compare more local tools of the same family, the difference from Graphify is laid out in this site’s article an MCP server that remembers code structure so agents need not read every file.