Meta's first frontier model Wonder keeps Full off the API
Wonder Full beats three rivals on 7 of 14 model card tests but isn't available through the API, where Wonder costs $4 in and $20 out and leads on 4.
The Muse Wonder you can buy through the API scores higher than competing models on 4 of the 14 tests on its model card, and Muse Wonder Full, which only subscribers can use, scores higher on 7. When Meta released the two models on Oct 12, these numbers were the evidence it offered for their competitiveness. But a 7-to-7 win-loss table tells very different stories depending on how you read it. The size of the lead ranges from +11.2 to +0.2, the party that measured the score and the harness (the framework that runs the test) differ from row to row, and two of the 14 rows are composite scores built by bundling other rows. This article reads the 14 rows one by one, then follows how those scores connect to unit prices, tokens and subscription fees. The values come from Meta’s blog, model card and developer docs, plus the model page of the independent evaluator Artificial Analysis (AA below), as of Oct 27. One entry in the model card was corrected on Oct 23, after release.
One name, two doors
Muse Wonder is the next step up from the earlier Spark 1.1 to 1.3. Meta says it built the model by stacking pretraining and reinforcement learning on a larger base model, and that it targets coding and long-running agent work. It takes text, images, video and audio as input, produces text as output, and has a context length of 1,048,576 tokens. The model card gives no size information such as parameter count or architecture. What differs is not the model but the way you reach it.
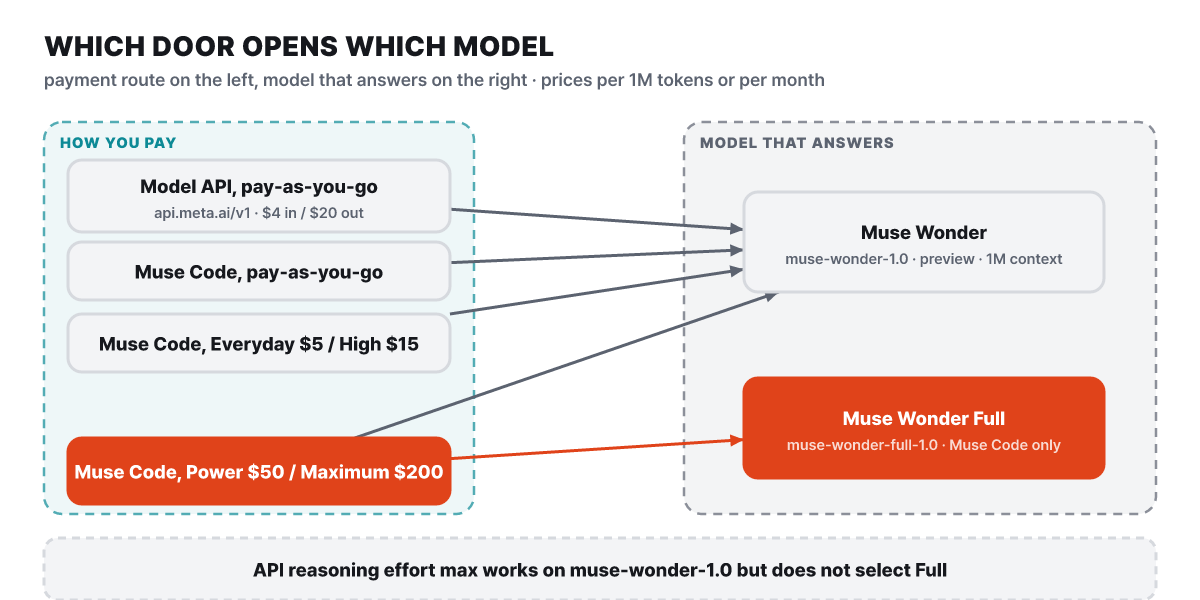 Figure 1. Which model you can reach depends on how you pay. The only route to Wonder Full is a Muse Code subscription of $50 a month or more
Put into words, the routes in the diagram work like this. The model IDs are muse-wonder-1.0 (API and Muse Code) and muse-wonder-full-1.0 (Muse Code subscription only). The API base URL is https://api.meta.ai/v1, and it supports three formats: Responses, Chat Completions (OpenAI-compatible) and Messages (Anthropic-compatible). In the Model API, Wonder is still a preview, and there are no open weights. The models Meta’s docs count as open-weight are Muse Spark Open and Muse Glimmer. The model entries in the developer docs name the regions where these two models are not offered, so check that entry before signing up or paying.
The most common misunderstanding is that the API’s reasoning effort can stand in for Full. Reasoning effort has seven levels, none, minimal, low, medium, high, xhigh and max, and max is supported on muse-wonder-1.0 too, but the docs state flatly that this is not a way of choosing Wonder Full. The same docs say Wonder is a thinking model, so sending none is rejected with HTTP 400. This is why expecting API results that match Full’s scorecard in the model card will leave you disappointed.
Coloring 14 rows and 5 columns by rank
On the model card, Meta compared Wonder Full and Wonder with Claude Fable 5.1, GPT-6 Astra and Claude Opus 5.5, and ran every model at its highest reasoning effort. The scales differ from test to test (some rows treat 13.1 as high, while 85.5 is ordinary in others), so coloring everything with one shade scale would be unreadable. The figure below therefore colors each cell by rank within its row and prints the actual score as text. The dark cell is the winner of that row.
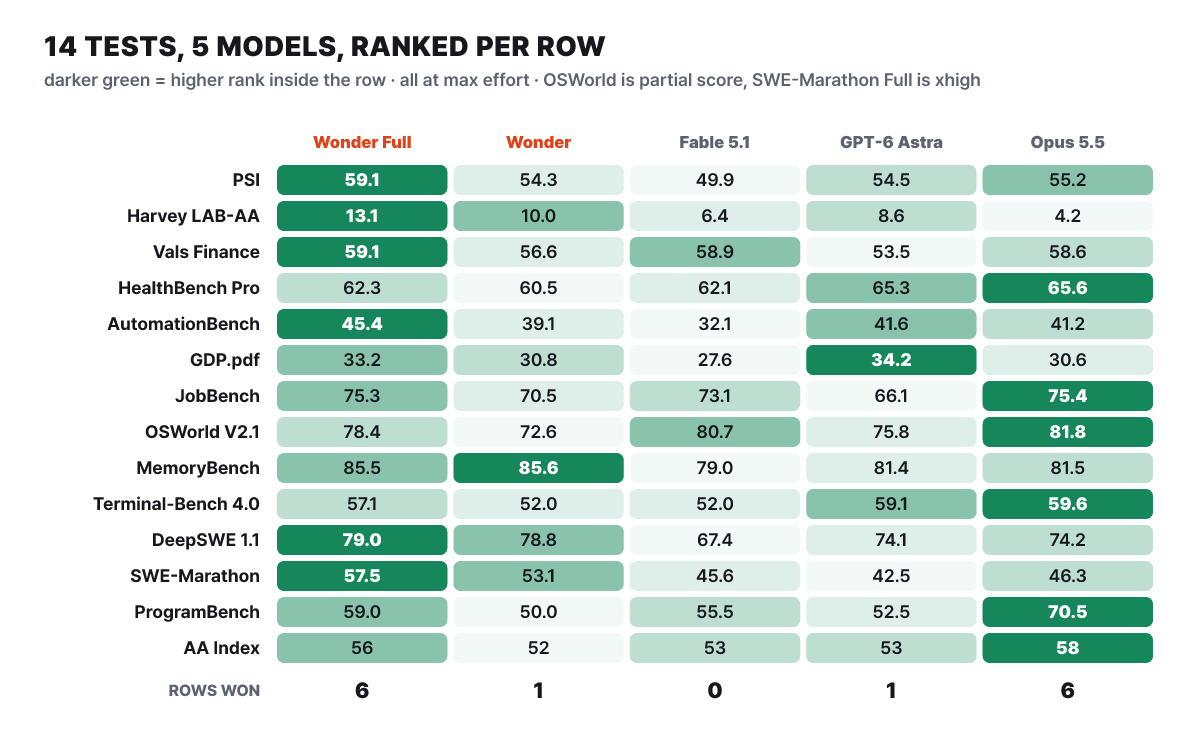 Figure 2. The 70 cells of the model card scorecard. OSWorld V2.1 uses partial scores, and Full’s SWE-Marathon value is the xhigh one
The win counts on the bottom row are Full 6, Opus 5.5 6, Wonder and GPT-6 Astra 1 each, and Fable 5.1 0. Wonder’s one win is the memory test MemoryBench (85.6), where Full scores 85.5, a 0.1-point difference. This row is why the win count and the number of rows where Full leads differ, 6 versus 7. Looking only at the three rivals, Full (85.5) is 4.0 points ahead of the highest of them, Opus 5.5 (81.5), so it does count as a row “higher than competing models”. Opus 5.5, in turn, is on top in six rows: the health-question test HealthBench Pro, the job test JobBench, the computer-use test OSWorld V2.1, the terminal-coding test Terminal-Bench 4.0, ProgramBench (rebuilding from scratch) and the composite index AA Index. GPT-6 Astra has one row, the PDF-source work test GDP.pdf (34.2).
Seven rows ahead and seven behind, but not the same size
Instead of counting wins and losses, let’s look at point distances. In the figure below, each row plots Full and the highest score among the three rivals as dots, ordered by size of the gap. Green bars are rows where Full leads, and red bars are rows where it falls behind.
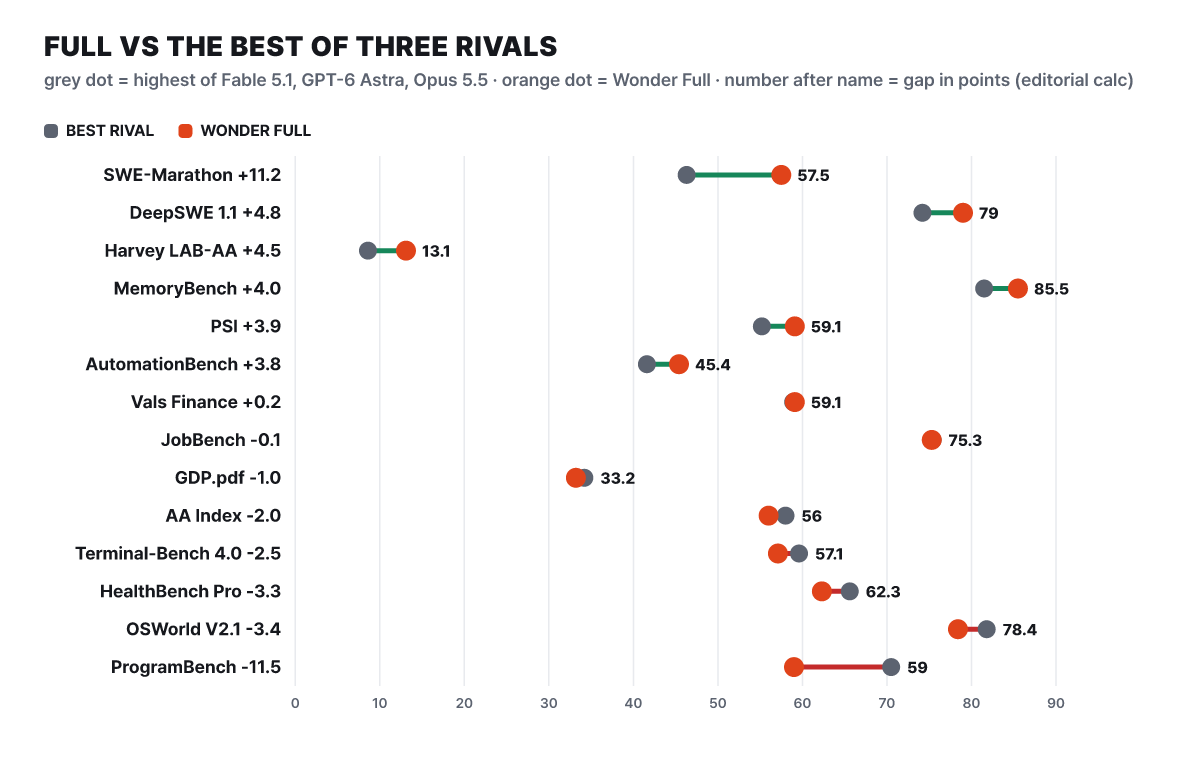 Figure 3. The difference between Full’s score and the best of the three rivals. The number after each name is the score difference calculated by our editors
What stands out is that the two ends are about the same size. The biggest lead, SWE-Marathon, is +11.2, and the biggest deficit, ProgramBench, is -11.5. The deficits across all seven rows where Full trails add up to 23.8 points, and ProgramBench alone accounts for almost half of that (11.5 points). On the other hand, Vals Finance (+0.2) and JobBench (-0.1) differ at the first decimal place, which is too thin to count as a win or a loss. Counting only rows that differ by 3 points or more gives 6 rows ahead and 3 behind. The same scorecard can be “7 to 7” or “6 to 3”, which means that which rows you count, and by what standard, decides the conclusion.
The score Full added is not the same number as the lead
Only Wonder can be used through the API, so what you actually want to know from Full’s scorecard is how many points come from being Full. The figure below puts the Full-minus-Wonder score (the amount the subscription model adds) on the horizontal axis and the Full-minus-best-rival score (how far ahead it is) on the vertical axis. Red dots below the dotted line are rows where Full falls behind.
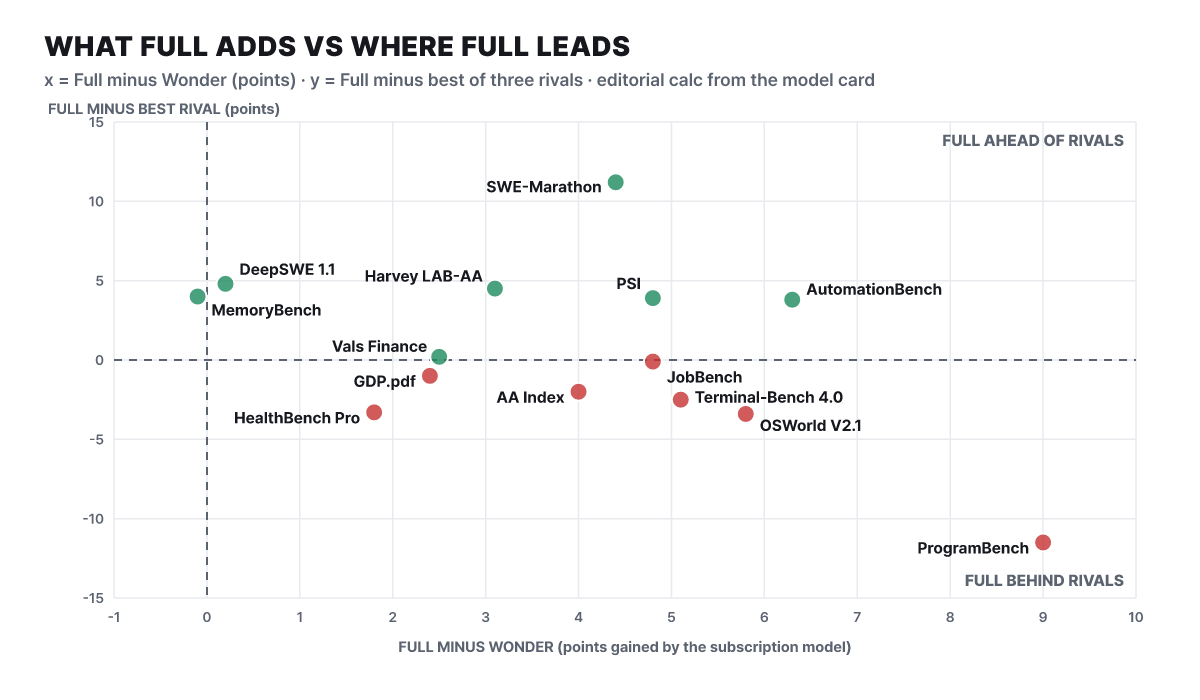 Figure 4. Horizontal is the points added going from Wonder to Full, vertical is the distance to the rivals (both calculated by our editors)
The two dots right next to the vertical dotted line, near 0 on the horizontal axis, are DeepSWE 1.1 (+0.2) and MemoryBench (-0.1). On these two rows Wonder scores essentially the same as Full, so being ahead of the rivals is not Full’s doing either. The rows where Wonder alone beats the best rival score are four: Harvey LAB-AA (+1.4), MemoryBench (+4.1), DeepSWE (+4.6) and SWE-Marathon (+6.8). On the other ten, Wonder falls short of the best rival. Of the 7 rows where Full is said to lead, the remaining three (PSI, Vals Finance and AutomationBench) are rows that Full’s added points flipped.
ProgramBench, at the far right, shows the biggest gain from Full, which adds 9.0 points to Wonder, and still falls 11.5 points short of the best rival. For Wonder alone the gap is 20.5 points. The point of this figure is that the row where the subscription model adds the most points is also the row where it falls furthest behind. The computer-use test OSWorld (+5.8) and the work-automation test AutomationBench (+6.3) are also rows with large gains from Full. SWE-Marathon, however, is not a like-for-like comparison, as the note under the table in the next section explains.
A different ruler for each score
Even for the same kind of “dot”, who measures it and under what conditions differ. Here are the descriptions in the model card, arranged row by row.
| Test | What it measures | Score source |
|---|---|---|
| PSI | Composite of seven tests: Agents’ Last Exam, AutomationBench-AA, FocusBench, JobBench, GDP.pdf, VBT and DRACO | Meta internal index |
| Harvey LAB-AA 1.1 | Share of tasks where the legal deliverable passes every criterion and the hallucination check | Artificial Analysis |
| Vals Finance Agent V2 | Accuracy on a private test of financial analyst tasks | Vals AI |
| HealthBench Pro | 525 health questions answered without tools and graded against physician-written rubrics | Run by Meta; Fable 5.1 and Opus 5.5 use Anthropic system card values |
| AutomationBench-AA | Share of workflows that pass every end-state check (strict pass@1) | Artificial Analysis |
| GDP.pdf | Professional work based on raw PDF sources | Surge |
| OSWorld V2.1 | 108 tasks on an Ubuntu desktop. Partial score and strict completion score | Meta’s common internal harness; Opus 5.5 uses Anthropic’s reported partial score |
| MemoryBench | Asking about facts in 64K to 100K token conversations, after distracting dialogue and statements that reverse them | Meta internal test |
| Terminal-Bench 4.0 | Verifying the final container state in an isolated terminal | Artificial Analysis |
| DeepSWE 1.1 | Long-horizon coding across 91 repositories and 113 tasks, pass@1 | Datacurve (Full, Wonder, Opus), OpenAI report (Astra), Anthropic system card (Fable) |
| SWE-Marathon | Large projects graded by running tests, pass@1 | Abundant AI leaderboard |
| ProgramBench | Rebuilding an entire program without internet, share of attempts passing 95% or more of tests | All models run with mini-swe-agent |
| AA Index v4.3 | Composite of GDPval-AA, AutomationBench-AA, GDP.pdf, Terminal-Bench 4.0 and others | Artificial Analysis |
Three things stand out from the table. First, the 14 rows are not independent of each other. PSI already includes AutomationBench-AA, JobBench and GDP.pdf, and the AA Index already includes AutomationBench-AA, GDP.pdf and Terminal-Bench 4.0. Drop the two composite rows and count the 12 independent tests, and the record is 6 to 6. Second, among the 7 rows where Full leads, only PSI and MemoryBench are Meta’s internal tests, and the other five use external results from AA, Vals AI, Datacurve and Abundant AI. Third, sources get mixed even within a single row. On DeepSWE, the Astra and Fable values were published by their providers, so they were not measured by the same institution.
The comparison conditions carry caveats too. On SWE-Marathon, GPT-6 Astra and Claude Fable 5.1 are leaderboard values run with Codex and Claude Code respectively, while Wonder Full was reported at the xhigh reasoning effort, so this is not a controlled comparison on a common harness. The rule for choosing scores is to use a comparable third-party or provider-reported value if there is one, and otherwise the highest of an internal verified run, a self-report or the official leaderboard. For values Meta ran itself on competing models, the card says it ran them with common settings where possible but they may not be optimized for each model, and that an answer the model refused is scored 0 and stays in the denominator.
13.1, 39.4 and 59.0 are what percent of what
Read the labels on the numbers and their size changes. The 13.1 on Harvey LAB-AA, where Full leads the rivals by 4.5 points, is the share of legal-document tasks whose deliverable met every criterion and also passed the hallucination check. Flip it over and nearly nine in ten (86.9%) fall short of some criterion. “First place” and “fine to use as is” are different stories, and the card too describes the purpose in legal, financial and health fields as “preparing drafts for review”.
OSWorld V2.1 has two sets of numbers in one row. The card’s main metric is the average of per-task partial scores, giving Full 78.4 and Wonder 72.6, but the strict score (binary), which only checks whether the task was completed end to end, is Full 39.4 and Wonder 34.3. In the same row, Fable 5.1 scores 80.7 partial and 43.1 strict, and GPT-6 Astra scores 75.8 and 34.3. Switch to the strict standard and Fable passes Full, while for Opus 5.5 only a partial score exists, so there is no strict value to compare. For someone building an agent that works by looking at the screen, the number that matters may be the rate of going all the way, not the partial score. In the API this is available only by putting {“type”: “computer”} in Responses tools, and you have to provide the environment that takes screenshots and executes clicks. Actions may carry safety check items (pending_safety_checks), and the docs instruct you not to approve them automatically but to confirm only when a person accepts. The docs also describe a way to cut cost on long tasks by running the same loop on the cheaper muse-spark-1.3.
ProgramBench’s 59.0 means that 59% of attempts passed 95% or more of the hidden tests. The name sounds like “building a program from scratch”, but the card defines it as rebuilding a finished program whole in an environment with the internet cut off. On this row Opus 5.5 (70.5) beats both Wonder Full (59.0) and Wonder (50.0), and given that definition it is not a test that represents everyday coding requests like “write me a new feature”.
FocusBench, which is part of PSI, and MemoryBench are the tests that measure active memory and active focus, which Meta puts forward as the two models’ distinguishing features. Meta describes active memory as the ability to carry a user’s context across conversations and retrieve the latest value after it changes, and active focus as trying different approaches toward a goal and confirming before important actions. Both are Meta internal tests, and MemoryBench is graded by a judge model using a per-question weighted rubric.
Numbers outside the price list
The price is $4.00 per 1M input tokens, $0.20 for cached input and $20.00 for output. Compared with Spark 1.3 on the same Model API ($1.25 input, $0.15 cached, $4.25 output), input is 3.2 times, output about 4.7 times and cache 1.3 times as much. There is no surcharge tier for longer contexts, and the system instructions Meta inserts into requests are neither billed nor counted in usage. The web search tool adds $2.50 per 1,000 calls on top of token costs, and the limits apply to the whole team rather than each key: 3,000 requests per minute and 4 million tokens. The lower prices for allowing training use (Contributor) are for Spark only and do not exist for Wonder.
The proof that unit prices alone can’t build an invoice is AA’s measurement. These are Wonder’s values measured at the highest reasoning effort.
The composite index is 52, ranked 10th of 215 models (viewed Oct 27). It uses about 1.5 times the median in output tokens and takes about 9 times as long to the first token, but once it starts it runs at 194.7 tokens per second, 16th of 182 (median 83.8). It is a model that thinks for a long time and starts slowly, but is fast once it begins to speak. Thinking tokens are billed at the $20 output price even though you can’t see them, and they share the same output limit (max_output_tokens, or max_tokens in Chat Completions) with the visible answer. A small limit cuts the answer off while the model is still thinking, so for the first few calls you should check reasoning_tokens in the usage (inside output_tokens_details in Responses). The billing docs also note that non-English text and code can produce more tokens for the same content, so if your input is mostly that, set the budget from the actual token counts on the dashboard.
Why the same 30 turns can cost $50.40 or $2.81
A bigger variable than the gap in unit prices is the cache. Suppose you attach a 400,000-token repository at the front and ask follow-up questions 30 times. Each turn is simplified to a new question of 5,000 tokens and 3,000 output tokens including reasoning, with the first request paying the input price because nothing is in the cache yet, and the whole 400,000-token prefix hitting the cache on the next 29. This is an editors’ example calculated from the price list.
| The same 30 turns | First request | Each later turn | Total |
|---|---|---|---|
| Wonder, no cache | $1.68 | $1.68 | about $50.40 |
| Wonder, cache hit | $1.68 | $0.16 | about $6.32 |
| Spark 1.3, cache hit | $0.52 | $0.08 | about $2.81 |
The difference that caching makes on Wonder (about 8 times) is much bigger than the difference between Wonder and Spark (about 2.2 times). One turn at $0.16 breaks down into $0.08 for cached input, $0.06 for output and $0.02 for the new question, so even after the cache hits, output is the second-largest item. You need to check with cached_tokens in the response that the cache actually hits, and this calculation only holds if the fixed part (the repository) comes first and the changing part (the question) comes last. Raising the reasoning effort increases the 3,000 output tokens in the table above.
Dividing the fee by one unit of usage
Muse Code has four subscriptions, with these values from the official product page. Usage refreshes in 5-hour windows, and on Everyday it is around 10 to 50 prompts every 5 hours.
| Plan | Monthly price | Usage (relative to Everyday) | Models included |
|---|---|---|---|
| Everyday | $5 | 1x | Spark, Wonder, Image |
| High | $15 | 5x | Same as above |
| Power | $50 | 20x | Above + Wonder Full |
| Maximum | $200 | 80x | Same as Power, only usage is 4x |
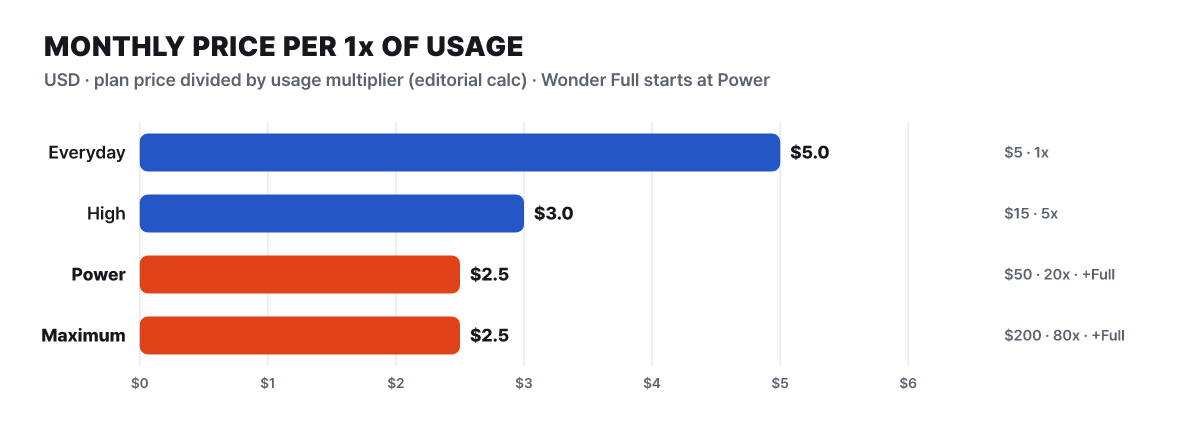 Figure 5. Monthly price per 1x of usage (calculated by our editors). Wonder Full is included from Power up
The higher you go, the cheaper the same usage gets. Power and Maximum cost the same per 1x, so Maximum is the plan for people who want to use Full for longer. Upgrades apply immediately and are prorated for the remaining period, downgrades take effect from the next billing cycle, and cancellation lets you keep using the plan until the billing cycle ends and must be done 24 hours before the next billing date. There are no refunds unless the law requires them. The default model in Muse Code is muse-spark-1.2 according to the docs, so to use Wonder you specify it with –model or switch with /models midway, and you check remaining usage with muse usage.
Carrying the scatter plot above over to the subscription decision gives two branches.
Rows with a big gap between Full and Wonder
- ProgramBench (+9.0), AutomationBench (+6.3), OSWorld partial score (+5.8), Terminal-Bench (+5.1)
- PSI and Vals Finance are rows where Full’s added points carry it past the best rival, so if this kind of work is your focus, they are grounds for subscribing
Rows where Wonder alone is ahead or equal
- DeepSWE 1.1 (+0.2) and MemoryBench (-0.1) are rows where Wonder and Full score essentially the same
- On SWE-Marathon and Harvey LAB-AA, Wonder alone beats the best rival (+6.8, +1.4)
Subscription defaults and a safety figure that was corrected once
Apart from scores, subscriptions come with a data setting. The Muse Code subscription defaults to Contributor mode, which in the docs’ wording gives you more usage in exchange for letting Meta use your content to train future models. You can turn it off at any time, and content after you turn it off is said not to be used for training. In interactive mode it is the Model entry in /settings, and in non-interactive muse exec it is –contributor-mode off or the environment variable MUSE_CONTRIBUTOR_MODE=0, with the flag taking precedence over the environment variable. This entry does not appear for pay-as-you-go billing, for accounts with data retention blocked (Zero Data Retention) or for settings managed by an organization. If company code goes into subscription conversations, check the setting before you start.
Safety evaluations read the same way. The model card’s risk assessment is based on the most capable model, Wonder Full, and looks at three areas: chemical and biological, cyber, and loss of control. It says that without safeguards, you cannot assert that the model stays below the “high risk” threshold in the chemical and biological area, and that it was blocked with safety post-training and system classifiers. In the final evaluation, after passing through the safeguards, every area is “moderate or below”.
| Evaluation | Full result | How to read it |
|---|---|---|
| CyberGym / ExploitBench | 88.4% / 58.9% | Cyber capability. Higher means more capable |
| ExploitGym | 20 intended flags | Value after the Oct 23 correction |
| Cyber jailbreak attack success rate (single / multi-attempt) | CyberBench 0.8 / 0.8, PolyGuard 1.1 / 2.3, RedCode 9.0 / 8.0 (%) | Lower is better. RedCode gets through nearly once in ten tries |
| Biosafety refusal rate | BioTIER English 98.7%, multilingual 98.7%, adversarial variants 98.2% | Higher is better |
| Honesty and loss of control | MASK 87.3%, Agentic Misalignment 0% | Higher is better for the first, lower is better for the second |
ExploitGym is the row whose value changed eleven days after release. Meta fixed the harness so that the intended vulnerability goes into the prompt and reran it, replacing the earlier value of 21 intended flags out of 92 total flags with 20 intended flags, the official leaderboard method. It says the risk level did not change because of the correction. The blog announced that the full safety report with the additional evaluations will be released “soon”.
Where the scorecard doesn’t reach
The model card lists six limitations. It can produce inaccurate or biased answers, it can make mistakes in multi-step reasoning on new situations that are rare in the training data, and visual and spatial reasoning, especially 3D tasks, is still weak. It was not evaluated in every language in the pretraining data, so performance can drop outside the languages it strongly supports, performance varies with quantization, serving settings, prompts, tools and agent harness, and it is not intended for use by people under 18. For deployment as an agent that takes real actions, the card recommends putting in a step where a human confirms irreversible actions. That points the same way as active focus’s “confirm before important actions”.
The fifth item in this list of limitations is the one that connects directly to the scorecard. The sentence that performance varies with harness and prompt is a footnote that applies to any of the 14 rows, and that is why the 7-to-7 figure is not a ranking of the models but a count of the 14 tests Meta chose, each given equal weight. The most useful way to use this table is to pick the one or two rows among the 14 that look most like your own work, read the distance between Wonder, Full and the rivals on those rows, and then run a few of the same tasks yourself to see whether that distance holds on your side too.