Pricey model on easy questions? Cut costs with LLM routing
Sending just 13.4% of questions to the strong model reaches 95% quality, per a paper. We priced a 1M-message chatbot, break-even, and four router placements.
If a shopping-mall chatbot sends all 1 million monthly questions to a premium model, the bill is $24,700. Send only 13.4% of them to the premium model and leave the rest to a cheap one, and it drops to $3,518. Same chatbot, same 1 million questions; the only change is one judge that picks a model for each question. These two numbers are our own calculation, scaling the RouteLLM paper’s MT Bench result (95% of the premium model’s score) up to a shopping-mall workload, so this article is about how far you can trust them as they stand.
That is why we start from the bill. First we draw the cost and quality curve against the share of calls sent to the strong model, using the paper’s tables, and then use that curve to work out a monthly bill and the break-even point. After that come why the curve differs from test to test, how to redraw it with your own questions, and where a router can sit. The reference date is October 27, 2026.
A straight line between $24.70 and $0.24 per million tokens
LLM APIs bill the number of tokens processed times a unit price. The RouteLLM paper (arXiv 2406.18665) from the model-evaluation group LMSYS assumes about $24.7 per million tokens for the strong model (GPT-4 family) and about $0.24 for the weak model (Mixtral 8x7B) in its cost calculations. The GPT-4 figure is an estimate blended from the price list at the time and average input and output lengths. Both models are from 2024, so what matters is that the same formula holds if you plug in the prices of whatever model pair you use today.
The formula is simple. If r is the share sent to the strong model, the blended price per million tokens is 0.24 + 24.46 × r dollars. Assuming every call uses the same number of tokens, it is a straight line, not a curve: halve the share and the cost halves exactly. Send half and you pay $12.47; send 10% and you pay $2.69.
If cost is a straight line, quality is the only thing left to examine. If quality fell at the same rate as the share, you would not need a router; you could flip a coin to mix the models. A router earns its keep because quality does not fall in a straight line. It bends.
Quality bends instead of falling in a straight line
The judge reads a question and computes the probability that the strong model would give a better answer than the weak one. If that value is at or above a user-set threshold (alpha, in the paper’s notation), the question goes to the strong model; otherwise it goes to the weak one. The judge learns from human pairwise votes collected on Chatbot Arena, which LMSYS runs: records of people viewing two models’ answers side by side and picking the better one. The paper started from about 80,000 votes, removed 5,000 for validation plus short prompts, and used 65,000 pairs (64 models, 81% English). Raising the threshold narrows the road to the strong model, which makes things cheaper and riskier.
Quality is measured on a scale called PGR (performance gap recovered). Using only the weak model is 0, using only the strong model is 100, and PGR shows how far up between them the router got. CPT(50%) is the minimum share of strong-model calls needed to reach PGR 50; lower is better. The figure below is the curve drawn from the MT Bench values in the paper’s Table 1. The horizontal axis is the share of strong-model calls and the blended price at that share; the vertical axis is PGR.
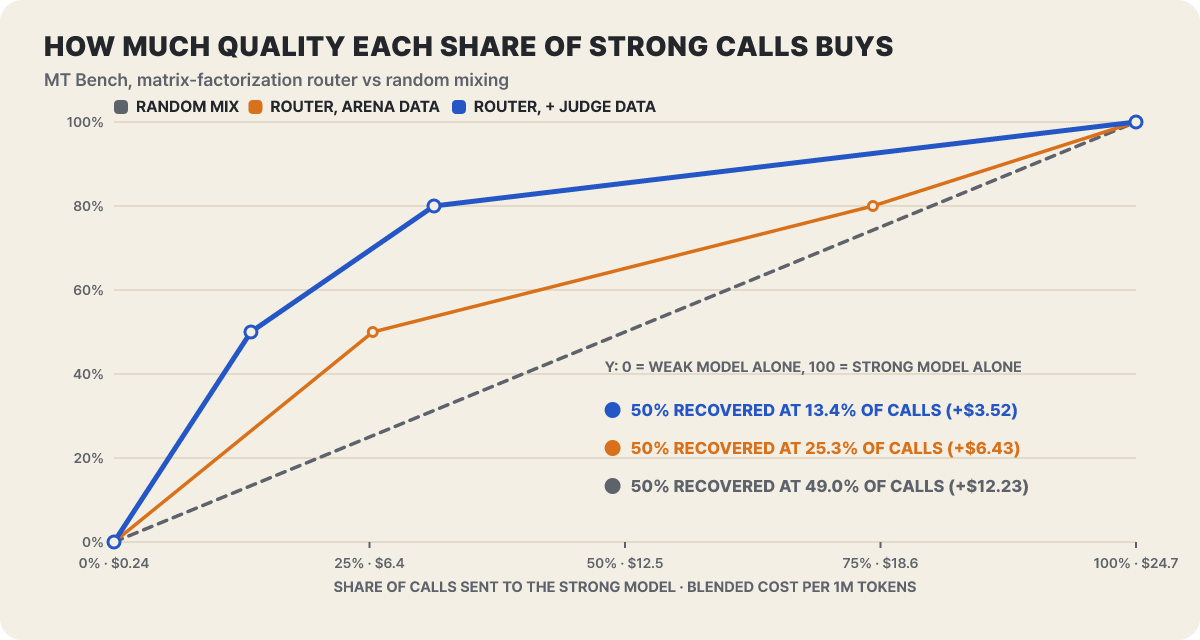 Figure 1. Recovery curve on MT Bench. Only the tabulated points (0, 50, 80, 100) are plotted, joined by straight lines. Price conversion is an editorial calculation
The diagonal is random mixing, and the two curves rising above it are routers. The router trained with extra data, namely GPT-4-as-judge scoring records, reaches PGR 50 at 13.4% strong-model calls and PGR 80 at 31.3%. The one trained on Arena data alone gets there at 25.3% and 74.3%. Random mixing needs 49.0% and 78.1%. The curve bows upward because the judge ranks questions in order of how much they need the strong model and sends the front of the line to the expensive model first. The first few percent close the biggest gap, and the gains thin out after that.
It is worth checking what PGR 50 means as an actual score. The paper reports that on MT Bench the score at PGR 50 is 8.8, against 9.3 for GPT-4 alone, which is 95%. Working backward from those two values puts the weak model Mixtral at about 8.3 (editorial calculation, approximate due to rounding), so doing nothing already secures 89% of GPT-4. On MMLU the PGR 50 point is 75 against GPT-4’s 81, or 92%, and the weak model is at about 69 (85%). On GSM8K it is 75 against 86, or 87%, and the weak model is at about 64 (74%). “95% quality” leans heavily on how good the weak model already is on that test.
Three price tags on the same 95%
The paper’s Table 6 lists “savings of 3.66x (MT Bench), 1.41x (MMLU), 1.49x (GSM8K).” It is easy to read these multipliers as comparisons with GPT-4 alone, but the paper’s text describes a different calculation: the GPT-4 call share a random router needs to reach the same quality, divided by the router’s share. For MT Bench that is 49.03 ÷ 13.40 = 3.66, and the baseline is random mixing, not GPT-4 alone.
Split the baseline in three and set up the cost per million tokens at the same PGR 50 point, and the picture changes. The bars below show, for each benchmark, the value for GPT-4 only, for random mixing, and for the best router.
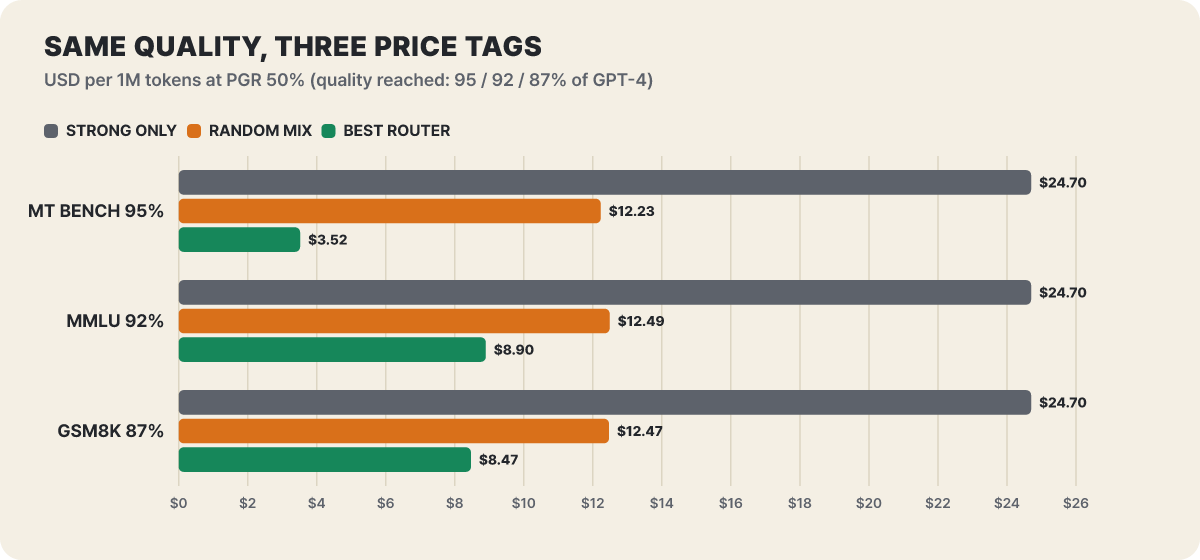 Figure 2. Cost per million tokens at the same quality point (PGR 50%). Values are an editorial calculation that puts the CPT(50%) from the paper’s Tables 1 to 3 into the price formula
Three things stand out. First, savings against the strong model alone are quite large: 85.8% on MT Bench, 64.0% on MMLU, 65.7% on GSM8K. The “over 85% on MT Bench” that the LMSYS blog led with uses this baseline. Second, a good part of that saving is available without any router. Random mixing alone brings all three tests down to around $12, and the extra amount a router earns is 71.2% on MT Bench, 28.7% on MMLU, and 32.1% on GSM8K. Third, when assessing the benefit of adopting one, you should write down “how much cheaper than strong-only” and “how much cheaper than just mixing” separately. The first number comes from the price gap between two models; the second comes from how well the judge actually sorts questions.
What 1 million chatbot messages cost in a month
First the assumptions. A shopping-mall chatbot receives 1 million messages a month, each averaging 1,000 tokens, for 1 billion tokens in total, or 1,000 units of one million tokens. Unit prices are the $24.7 and $0.24 from above, and the router sends 13.4% to the strong model. That share is the best MT Bench value in the paper, so with no guarantee shopping-mall questions will produce it, treat it as close to an upper bound.
- All strong model: 1,000 × 24.7 = $24,700
- With the router: (0.134 × 24.7 + 0.866 × 0.24) × 1,000 = (3.310 + 0.208) × 1,000 = $3,518. Savings: $21,182
- Assume 10% of the questions sent to the weak model fall short on quality and are re-sent to the strong model (re-requests): the strong share rises from 13.4% to 22.06%, giving (0.2206 × 24.7 + 0.866 × 0.24) × 1,000 = $5,657. The weak model’s cost for the re-sent questions has already been paid, so it stays on the bill
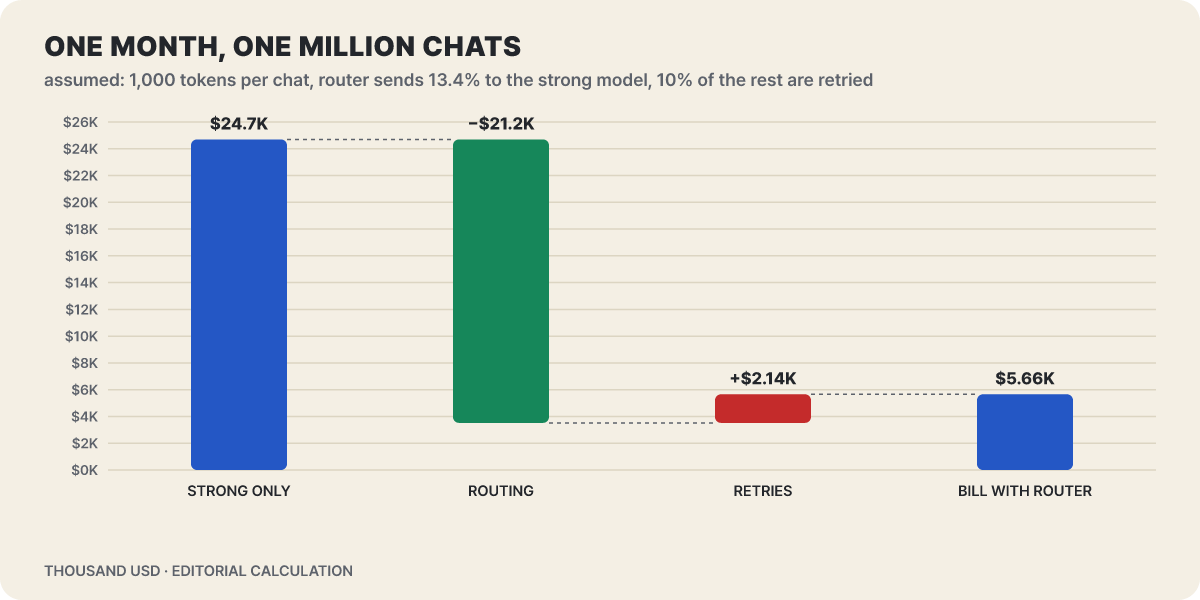 Figure 3. The monthly bill. Amounts are in thousands of dollars, and all are editorial calculations based on the assumptions
The 10% re-requests take back $2,139, which is 38% of the final bill with the router. Savings fall from 85.8% to 77.1%, but it is still much cheaper than sending everything to the strong model. The judge’s own running cost is too small to show up on the bill. In the paper’s measurement on a single-GPU VM ($0.8 per hour), the matrix-factorization router costs $1.42 per million requests at 155 requests per second, and even the heaviest, SW ranking (CPU-only VM), costs $37.36 at 2.9 requests per second. For the 1 million messages in this bill, that is $1.42, or 0.006% of the total.
Break-even has to be worked out from two directions. On money alone it is surprisingly loose. What share of the questions sent to the weak model would you have to re-send to the strong model before the routed bill equals the all-strong bill? Solving gives 1 − 0.24 ÷ 24.7, about 99%, independent of the routing share. With a 100x price gap, you do not lose on money even if nearly everything is re-sent.
The real boundary is quality. If fixing one extra bad answer caused by the router costs c dollars, break-even is the savings divided by c. Using the savings of $19,043 after re-requests above gives the following.
| Cost to fix one bad answer (assumed) | Break-even extra bad answers | Share of 1M messages |
|---|---|---|
| $0.5 (automatic retry or re-ask) | 38,086 | 3.81% |
| $2 (short agent intervention) | 9,522 | 0.95% |
| $10 (agent handling plus an apology coupon) | 1,904 | 0.19% |
| $20 (refund or dispute handling) | 952 | 0.10% |
The more one bad answer costs, the fewer misjudgments the router can be allowed. For a path where a single case is worth $20, such as calculating refund amounts, the limit is around 1,000 cases, so pinning it to the strong model beats leaving it to a router. By contrast, paths like delivery-status lookups, where a wrong answer can simply be asked again, are what routing is for. The count of bad answers here does not map directly to a score like PGR, so you have to count it separately in your own service.
Tests where the router wins and tests where it does not
The curve in Figure 1 belongs to MT Bench. The paper ran all three tests, two training datasets, and four router types, and the figure below shows where those 24 combinations sit relative to the random router (CPT 50 about 50%, CPT 80 about 80%). The horizontal axis is CPT(50%) and the vertical axis is CPT(80%); the lower left is better.
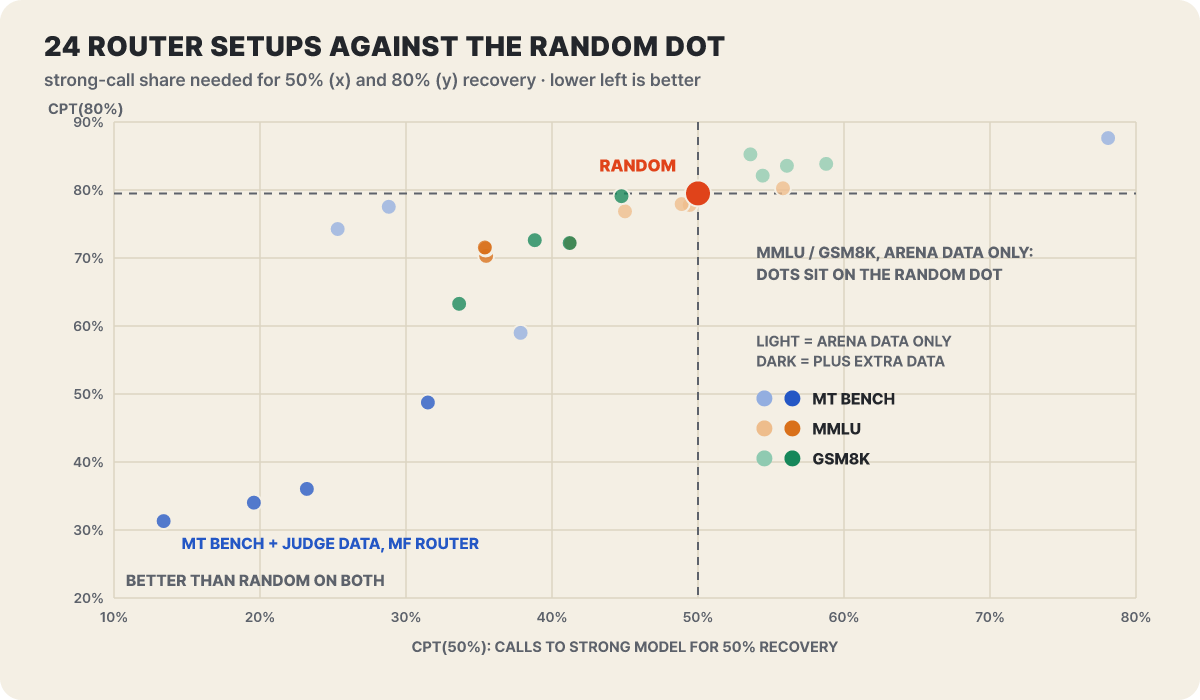 Figure 4. All of the paper’s Tables 1 to 3. Light dots are Arena data only, dark dots are training with extra data added
The points furthest to the lower left are the four MT Bench points with GPT-4 scoring records added, whose CPT(50%) is 13.4% to 31.5%. By contrast, the routers trained on Arena data alone for MMLU and GSM8K cluster around the random points. On MMLU the four routers’ CPT(50%) is 45.0% to 55.8%, close to random’s 50.07%, and on GSM8K it is 53.6% to 58.8%, worse than random’s 50.0%. Even with the same Arena training, the result flips depending on the test.
How far the extra data moves a point to the left is also striking. Adding about 1,500 MMLU validation questions (under 2% of the training data) with their answer labels as they were brought three routers’ CPT(50%) down to 35.4% to 35.5%, and adding an LLM judge’s scoring records for GSM8K brought the best router down to 33.6%. The paper scored how similar the training data is to the test questions (Table 4) and reported that similarity rose as extra data was added: from 0.608 to 0.653 on MT Bench, 0.482 to 0.568 on MMLU, and 0.493 to 0.534 on GSM8K. The more alike they are, the better the router sorts, which means a judge trained on Arena votes that do not resemble your shopping-mall questions could land at the upper right of this figure.
The router type matters too. Trained on Arena data alone on MT Bench, matrix factorization reaches CPT(50%) of 25.32%, while the BERT classifier reaches 78.09%, worse than random’s 49.03%. Transfer to other model pairs works comparatively well. Swapping in Claude 3 Opus and Llama 3 8B and running MT Bench without retraining, matrix factorization (with extra data) gave CPT(50%) of 30.48% and CPT(80%) of 41.81%. Still, the paper covers choosing between two models, and the authors leave cases with three or more candidates as future work.
How to redraw the curve with your own questions
If the curve differs from test to test, your service’s curve has to be drawn from your questions. Here is a way to do it from logs alone, without touching live traffic.
- Pull a sample from real question logs so that easy and hard ones are mixed. Our recommendation is 200 to 300, enough that the points stop jittering.
- Send each question to both the strong and the weak model and keep the answers. You pay this cost only once.
- Grade the two answers by hand or with a judge model. These grading records are the denominator and numerator of PGR.
- Rank the questions by the score the router gave each one (the probability the strong model wins). Pretend the top 10%, 25%, 50% and 75% went to the strong model and calculate quality, which gives four or five points.
- Convert the horizontal axis into money with the price formula (0.24 + 24.46 × r) and draw the curve. How far it opens up from the random-mixing line is the value of this router.
The command to draw the first line with RouteLLM is in the repository README. Install it, find the threshold that sets strong-model calls to 50%, and run the evaluation with the same configuration.
pip install "routellm[serve,eval]"

# Compute the threshold for 50% strong-model calls (based on public Chatbot Arena data)
python -m routellm.calibrate_threshold --task calibrate --routers mf --strong-model-pct 0.5 --config config.example.yaml
# Example output: For 50.0% strong model calls for mf, threshold = 0.11593

# Compare routers on MT Bench, MMLU and GSM8K (result graphs are created in the current folder)
python -m routellm.evals.evaluate --routers random sw_ranking bert --benchmark gsm8k --config config.example.yaml
The README’s calibration example prints a threshold of 0.11593 under the command but writes 0.1881 in the explanatory sentence, so the two places disagree. Use the printed value. This calibration is based on public Arena data, and the README also advises recalibrating with data that resembles the questions you receive. To do the same with your own sample, you have to count directly what share of top-scoring questions go to the strong model, as in step 4. The documentation also explains how to add a router. Implement just one method on the Router class, calculate_strong_win_rate (a function that takes a question and returns the strong model’s win rate), register it in ROUTER_CLS, and the server and evaluation tools can use it right away.
In Python, you put the controller where the OpenAI client would be. The model name follows the pattern router-<router name>-<threshold>.
from routellm.controller import Controller

# Supply keys through environment variables. mf and sw_ranking need OPENAI_API_KEY for question embeddings regardless of the model pair
client = Controller(
    routers=["mf"],
    strong_model="gpt-4-1106-preview",
    weak_model="anyscale/mistralai/Mixtral-8x7B-Instruct-v0.1",
)
response = client.chat.completions.create(
    model="router-mf-0.11593",
    messages=[{"role": "user", "content": "How far along is my order A105?"}],
)
For server mode, start python -m routellm.openai_server --routers mf --strong-model … --weak-model … and just change the app’s address to connect on port 6060. Model providers connect through LiteLLM, including Ollama, Anthropic, Gemini, Amazon Bedrock and Together AI; for OpenAI-compatible endpoints, put openai/ in front of the model name.
Four places that hold the knob on the curve
RouteLLM is not the only tool that does this job. The difference is what makes the judgment and where the knob that decides which point on the curve you stand at is attached. The figure below puts four options in front of the same app: the top three you run yourself, and the bottom one is a hosted service.
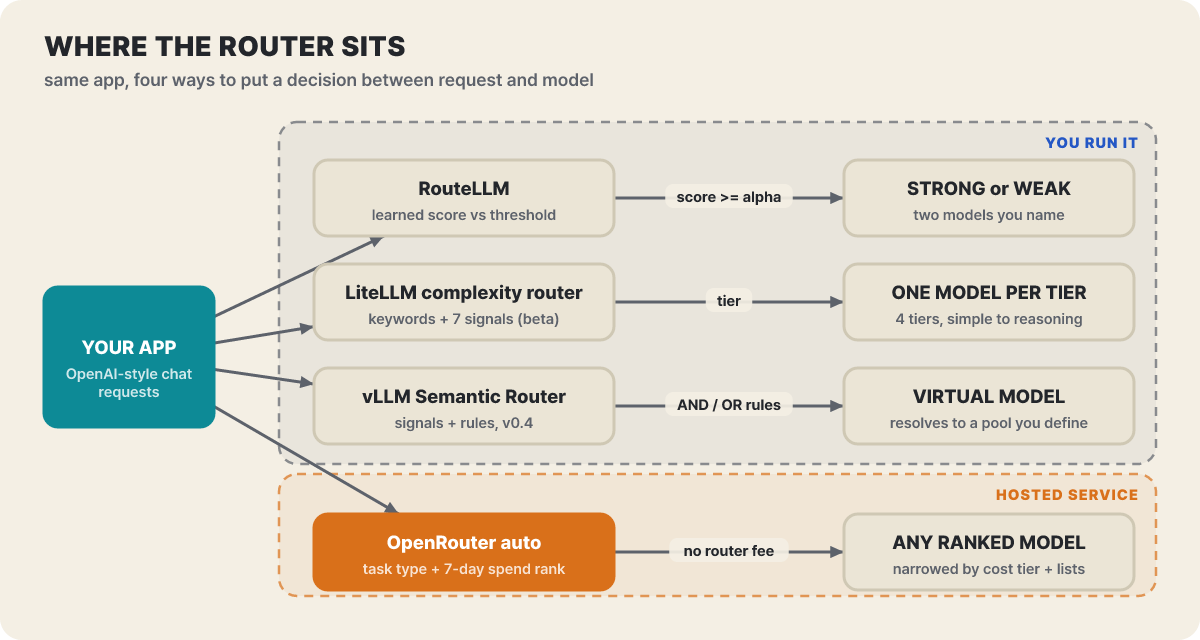 Figure 5. Places where a router can sit. On the app side the code stays almost the same; only the request address and model name change
| Tool | Knob | Basis for the decision |
|---|---|---|
| RouteLLM | Threshold alpha (router-mf-0.11593) |
Score learned from preference data |
| OpenRouter auto router | cost_tier (low to max), allow and exclude lists |
Usage ranking over the last 7 days by task type |
| LiteLLM complexity router | Model assigned per tier | Keywords and a seven-dimension heuristic score |
| vLLM Semantic Router | Decision rules, virtual models | Several signals combined with AND/OR/NOT rules |
The RouteLLM repository was created on June 3, 2024 and the paper came out the same month; the LMSYS blog introduced it on July 1, and the paper appeared as an ICLR 2025 poster. The repository is Apache-2.0 with 5,636 stars, 448 forks and 45 open issues (checked October 27, 2026), and its last push was August 10, 2024 (UTC) with no release entries. The built-in routers were trained on the GPT-4 1106 preview and Mixtral 8x7B pair, so for today’s model pairs it is more realistic to borrow the structure and evaluation method and rebuild the judge from your own data.
OpenRouter sells models from many companies through one API, and it has an auto router called openrouter/auto. A lightweight classifier sorts the prompt into one of about 30 task types (code:debugging, math, customer_support and so on), ranks models by their share of user spending over the last 7 days for that type, then applies the cost tier and allow list and picks the top remaining models as the primary and fallback models. What differs most from RouteLLM is that the signal behind the decision is other users’ choices, not a learned win rate. The router itself adds no charge, and you are billed only the standard rate of the model selected. If the classification or ranking cannot be loaded, it does not fail but answers with a default model set. Configuration goes in the request’s plugins array.
{
  "model": "openrouter/auto",
  "plugins": [
    {
      "id": "auto-router",
      "allowed_models": ["anthropic/*", "openai/*"],
      "excluded_models": ["openai/gpt-4o"],
      "cost_tier": "medium"
    }
  ],
  "messages": [{ "role": "user", "content": "How much is my refund if I cancel order A105?" }]
}
cost_tier is one of low, medium, high, xhigh and max, and it is the range of that tier rather than a ceiling, so both cheaper and more expensive models drop out of the candidates. If you send no setting at all, routing leans toward low. The allow list is applied first and the exclude list after, so exclusion always wins; if both are set and no candidate remains, you get a 404 error with “No models match your request and model restrictions”. The model field of the response holds the model actually used, and if you send an X-OpenRouter-Metadata: enabled header with the request, the classified task type is visible in the response metadata too. The beta track openrouter/auto-beta uses a different plugin ID, auto-beta-router, so each slug reads only the settings under its own ID and silently ignores the other.
LiteLLM’s complexity router is a beta feature configured on the proxy. It sorts a question into one of four tiers, SIMPLE, MEDIUM, COMPLEX and REASONING, and you assign one model (or a list of models) to each tier. The default judgment is a heuristic score over seven dimensions: token count, presence of code, reasoning markers, technical terms, simplicity markers, multi-step patterns and question complexity. It makes no LLM call, so it finishes in under a thousandth of a second. If there are two or more reasoning markers, the question goes to REASONING regardless of the score. The earlier semantic router that called embeddings is marked as scheduled for deprecation, and the docs say it costs 100 to 500 ms per call.
vLLM Semantic Router changed fastest. After v0.1 on January 5, 2026, it went through v0.2.0 on March 10 and v0.3.0 on June 5, and reached v0.4 “Hermes”, introduced on the blog on September 24 (released September 27, with 982 commits and 130 contributors); the repository has 6,266 stars. v0.4 promotes a structure in which the app calls just one virtual model name and the router picks a backend from a pool of qualified candidates. There are recipes for five purposes, Blend, Lite, Flash, Ultra and Vault; decision rules are built from AND/OR/NOT, tiers, and priority and confidence ranking; and plugins such as a response cache attach to it. These tools do not draw the curve for you; they are parts that decide a point on the curve, so the step of measuring on your own questions in the manner of Figure 1 remains whichever tool you pick. If you want a trained router as a hosted service, there are also services such as Not Diamond that offer pre-trained routers or custom routers trained on your data, usable through Python, TypeScript and REST SDKs.
RouteLLM (self-run)
- The knob is a single threshold, and you pick a point on the curve by number
- Recalibration and retraining on your own questions are possible
- You pay for server operation plus model fees
- The basis of the decision can be swapped for your own data, but it only handles a choice between two models
OpenRouter auto router (hosted)
- The knobs are the cost tier and the allow and exclude lists
- You cannot edit the decision criteria, only narrow the candidates
- Only model fees; no extra router charge
- There are multiple candidates and the previous model is favored; check the result by the model name in the response
Costs that leak outside the curve
Last, we collected the costs that the curve and the bill cannot show. Even if all the calculations above hold, the numbers in Figure 3 will be off if money leaks from the places below.
- The privacy path of embedding calls.
mfandsw_rankingturn the question text into an embedding on every judgment; the README says an OpenAI API key is required regardless of the model pair, and the paper used text-embedding-3-small. For questions containing personal data, where this call goes is something to inspect, and avoiding it leads you to thebertorcausal_llmfamilies that do not use embeddings. In the CPT table, though, BERT was worse than random on MT Bench with Arena-only training. - The model changing within one conversation. RouteLLM judges every call, so the model can change even within the same conversation, and tone and memory can drift. OpenRouter remembers the model used last and favors it on the next turn, but it recalculates the ranking every turn and keeps it only if it is still near the top. Either way, you must log the model name from the response to trace conversations that drifted.
- A hosted router with an empty allow list. In OpenRouter, an empty allow list makes every ranked model a candidate. If some models cannot be used because of where personal data is processed or because of contract terms, narrow them down with the allow list first, and decide in the app what to do when the restrictions leave no candidates and a 404 comes back.
- The hidden surcharge of re-requests. In Figure 3, 10% re-requests took 38% of the final bill. If the app does not verify the weak model’s answers, re-requests show up as users “asking again,” and neither the bill nor the logs tie them to routing. Record the model name and whether the question was re-asked together, and this share becomes visible.
- Confusing fallback with routing. OpenRouter’s
modelsarray is a mechanism for moving to the next model when the first fails from exceeding context length, rate limiting or an outage. It is not chosen to cut cost, and the rate of the model that actually handled the request is billed, so on the bill you have to read routing’s choices and fallback’s substitutions separately. - The shelf life of calibration. The threshold is tied to the question distribution and the model prices. If prices change or you swap the weak model for a new version, the curve moves, so re-measuring as in Figure 1 does not end once; it comes back every time the model pair changes. This is especially true for RouteLLM, whose built-in routers were trained on a 2024 model pair, and for a service where only one model is allowed under contract from the start, there is no need to draw the curve at all.